In a previous post we installed the tools necessary to access Microsoft SQL Server, continuing our quest I needed to monitor some filegroups and decided to create something like Pyora.
It only monitors filegroups (Primary used and Log used), but I plan to add more items like datasize, logcachehit, etc. The idea is pretty simple, ./pyssql.py fetch data from SQL Server via Zabbix.
Follow the instructions below to install and use it:
/tmp ❯❯❯ git clone https://github.com/bicofino/Pyssql.git                                                                                                                         ⏎
Cloning into 'Pyssql'...
remote: Counting objects: 11, done.
remote: Compressing objects: 100% (9/9), done.
remote: Total 11 (delta 1), reused 6 (delta 0), pack-reused 0
Unpacking objects: 100% (11/11), done.
Checking connectivity... done.
~/g/pyssql ❯❯❯ ./pyssql.py
usage: pyssql.py [-h] [--username USERNAME] [--password PASSWORD]
                 [--address ADDRESS] [--port PORT] [--database DATABASE]
                 {Logused,Primaryused,db_close,db_connect,show_databases} ...
pyssql.py: error: too few arguments

# List all databases
~/g/pyssql ❯❯❯ ./pyssql.py --username user --password secret --address 1.1.1.1 --port 1433 --database master show_databases                                    ⏎
{"data": [{"{#DATABASE}": "master"}, {"{#DATABASE}": "tempdb"}, {"{#DATABASE}": "model"}, {"{#DATABASE}": "msdb"}, {"{#DATABASE}": "ReportServer"}, {"{#DATABASE}": "ReportServerTempDB"}, {"{#DATABASE}": "SharePoint_Config"}, {"{#DATABASE}": "SharePoint_AdminContent_"}, {"{#DATABASE}": "Tfs_Configuration"}, {"{#DATABASE}": "Tfs_DefaultCollection"}, {"{#DATABASE}": "Warehouse"}, {"{#DATABASE}": "WSS_Content"}]}

# Check filegroup Primary size (in %)
~/g/pyssql ❯❯❯ ./pyssql.py --username zabbix --password zbxmonitor --address naptfsdb01.intra.cvc --port 1433 --database master Primaryused                                       ⏎
73.0

# Check filegroup Log size (in %)
~/g/pyssql ❯❯❯ ./pyssql.py --username zabbix --password zbxmonitor --address naptfsdb01.intra.cvc --port 1433 --database master Logused
48.0
Keep in mind that I have installed Pyssql on Zabbix Server(127.0.0.1).
Add the line below to the file /etc/zabbix_agentd.conf
UserParameter=pyssql[*],/opt/scripts/pyssql.py --username $1 --password $2 --address $3 --port $4 --database $5 $6 $7 $8
Create a new host for the database that you want to monitor:
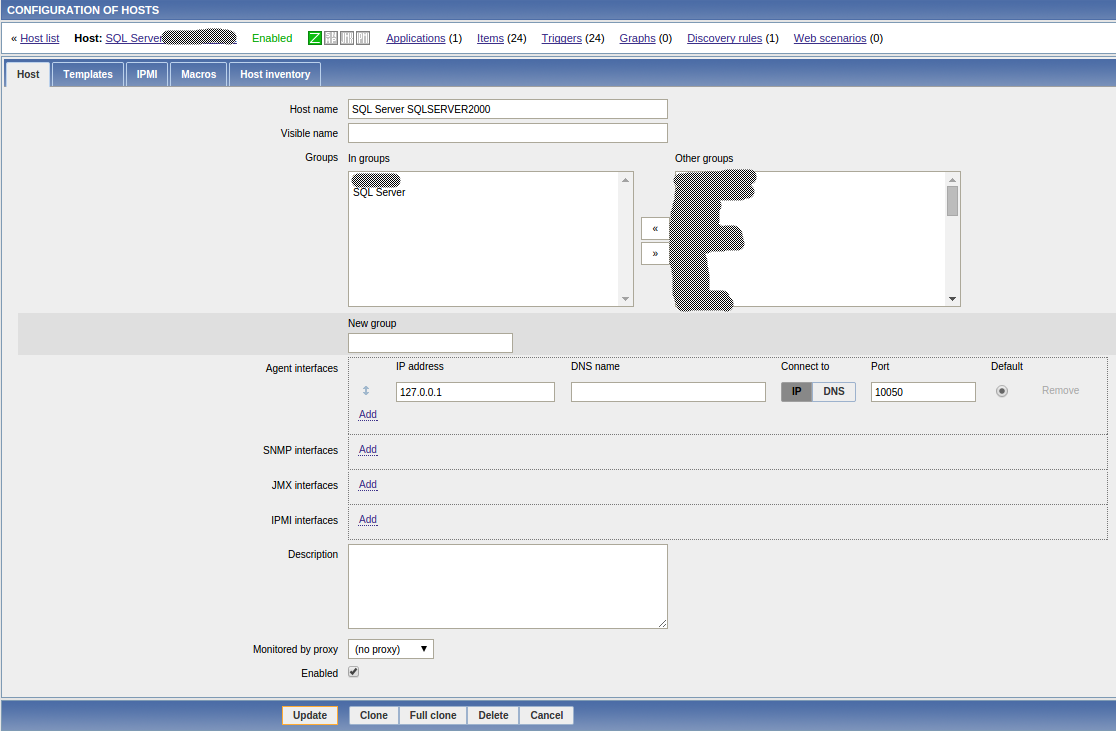
Import the template zabbix-template/Pyssql.xml to your new host.
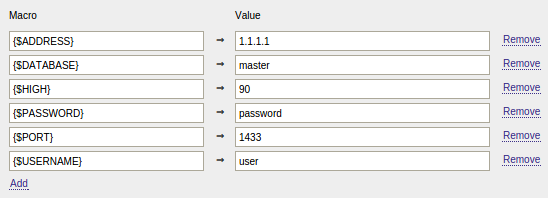
Let’s add a new host and configure the required macros
HIGH is used to alarm filegroup usage in %
{$ADDRESS} 1.1.1.1
{$DATABASE} master
{$HIGH} 90
{$PASSWORD} password
{$PORT} 1433
{$USERNAME} user
Now you just have to wait and check later the information:
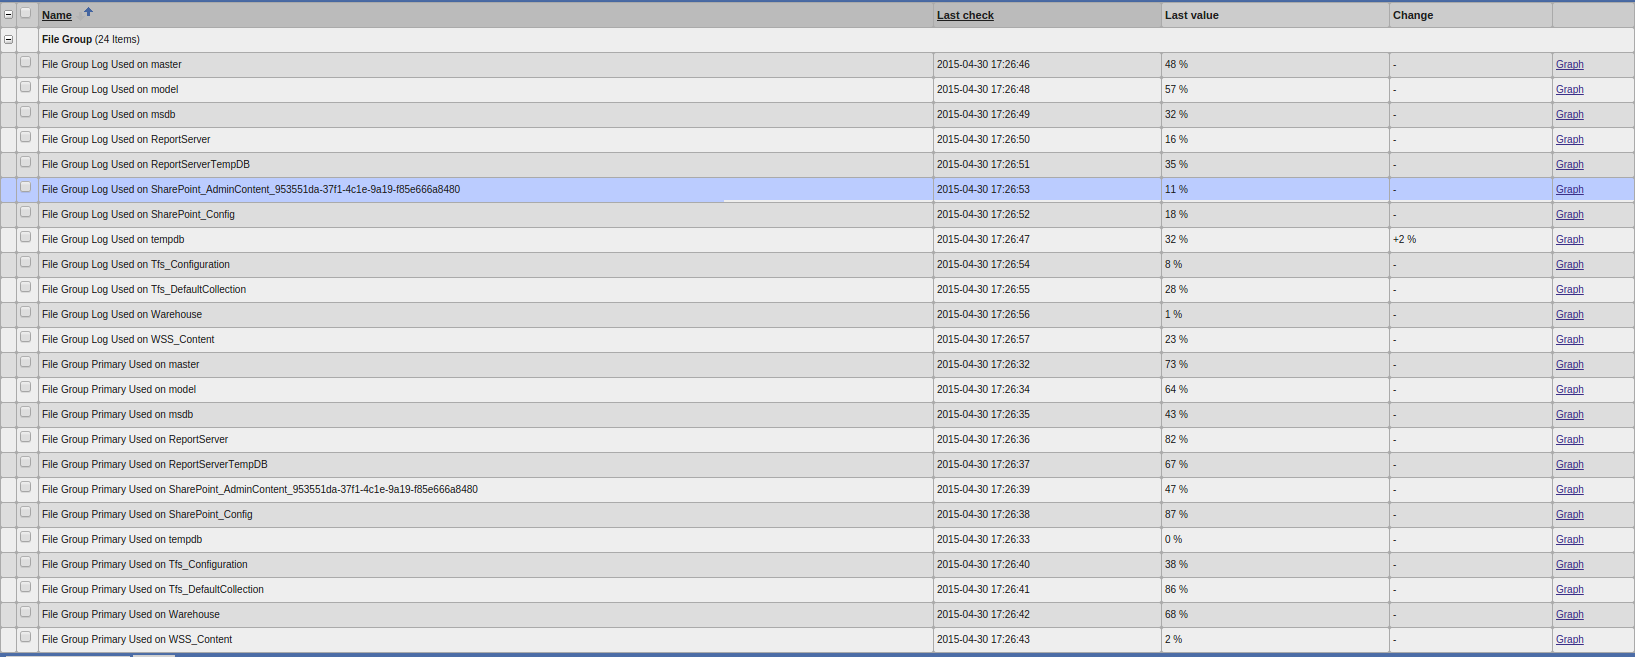
So far it meets my needs, of course, there is a lot to improve. Hope you find it useful.