In the past I used Zabora to monitor Oracle, but for large environments was a pain to admin and let’s not talk about monitor tons of tablespaces. I tried to use other things like Orabbix but since is Java I preferred stay away.
Today Zabbix have some nice improvements like macros and Discovery, so we can set the database settings(user,password,database and such) on the host using macros and not hard code it on a script that you have to access a server to change it. Also if Zabbix already discovery disks and network interfaces why not Oracle tablespaces? Then Pyora was born:
Pyora is a clean python script that uses cx_Oracle library to fetch data from the database. To use Pyora you need Oracle client and the cx_Oracle. I’m assuming that you have both installed on your system, if you don’t have it you check this page and install it.
danilochilene@ambush:/tmp
? git clone https://github.com/bicofino/Pyora.git
Cloning into 'Pyora'...
remote: Counting objects: 17, done.
remote: Compressing objects: 100% (14/14), done.
remote: Total 17 (delta 2), reused 16 (delta 1)
Unpacking objects: 100% (17/17), done.
» python pyora.py
usage: pyora.py [-h] [--username USERNAME] [--password PASSWORD]
                [--address ADDRESS] [--database DATABASE]

                {activeusercount,bufbusywaits,check_active,check_archive,commits,db_close,db_connect,dbfilesize,dbprllwrite,dbscattread,dbseqread,dbsize,dbsnglwrite,deadlocks,directread,directwrite,dsksortratio,enqueue,freebufwaits,hparsratio,indexffs,lastapplarclog,lastarclog,latchfree,logfilesync,logonscurrent,logprllwrite,logswcompletion,netresv,netroundtrips,netsent,query_lock,query_redologs,query_rollbacks,query_sessions,query_temp,rcachehit,redowrites,rollbacks,show_tablespaces,tablespace,tblrowsscans,tblscans,uptime,version}
                ...
pyora.py: error: too few arguments


# Check Oracle version
0: python pyora.py --username pyora --password secret --address 127.0.0.1 --database DATABASE version
Oracle Database 10g Enterprise Edition Release 10.2.0.4.0 - 64bi

# Check Oracle active user count
0: python pyora.py --username pyora --password secret --address 127.0.0.1 --database DATABASE activeusercount
68

# Show the tablespaces names in a JSON format
0: python pyora.py show_tablespaces
{
    "data":[
    { "{#TABLESPACE}":"ORASDPM"},
    { "{#TABLESPACE}":"MDS"},
    { "{#TABLESPACE}":"SOADEV_MDS"},
    { "{#TABLESPACE}":"ORABAM"},
    { "{#TABLESPACE}":"SOAINF"},
    { "{#TABLESPACE}":"DATA"},
    { "{#TABLESPACE}":"MGMT_AD4J_TS"},
    { "{#TABLESPACE}":"MGMT_ECM_DEPOT_TS"},
    { "{#TABLESPACE}":"MGMT_TABLESPACE"},
    { "{#TABLESPACE}":"RECOVER"},
    { "{#TABLESPACE}":"RMAN_CAT"},
    { "{#TABLESPACE}":"SYSAUX"},
    { "{#TABLESPACE}":"SYSTEM"},
    { "{#TABLESPACE}":"TEMP"},
    { "{#TABLESPACE}":"UNDOTBS"},
    { "{#TABLESPACE}":"VIRTUALCENTER"},
    ]
}

# Show a particular tablespace usage in %
0: python pyora.py --username pyora --password secret --address 127.0.0.1 --database DATABASE tablespace SYSTEM
92.45
I have installed Pyora on Zabbix Server, so I have a centralized script to monitor all my Oracle databases.
Add the line below to the file /etc/zabbix_agentd.conf
UserParameter=pyora[*],/home/zabbix/scripts/pyora.py --username $1 --password $2 --address $3 --database $4 $5 $6 $7 $8
Create a new host for the database that you want to monitor:
{% img http://bicofino.io/images/pyora_host.png %}
Import the template zabbix-template/Pyora.xml to your new host.
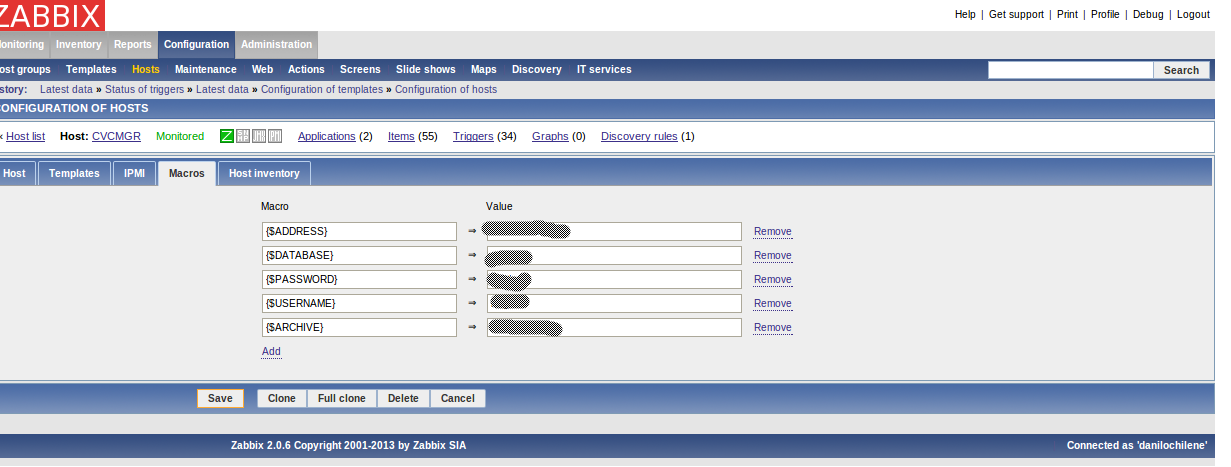
Lets add a new host and configure the required macros
HIGH is used to alarm tablespace usage in %
{$ADDRESS} 192.168.0.1
{$DATABASE} MY_ORACLE_DATABASE
{$USERNAME} zabbix
{$PASSWORD} zabbix
{$ARCHIVE} VGDATA
{$HIGH}	90
Now you just have to wait and check later the information:
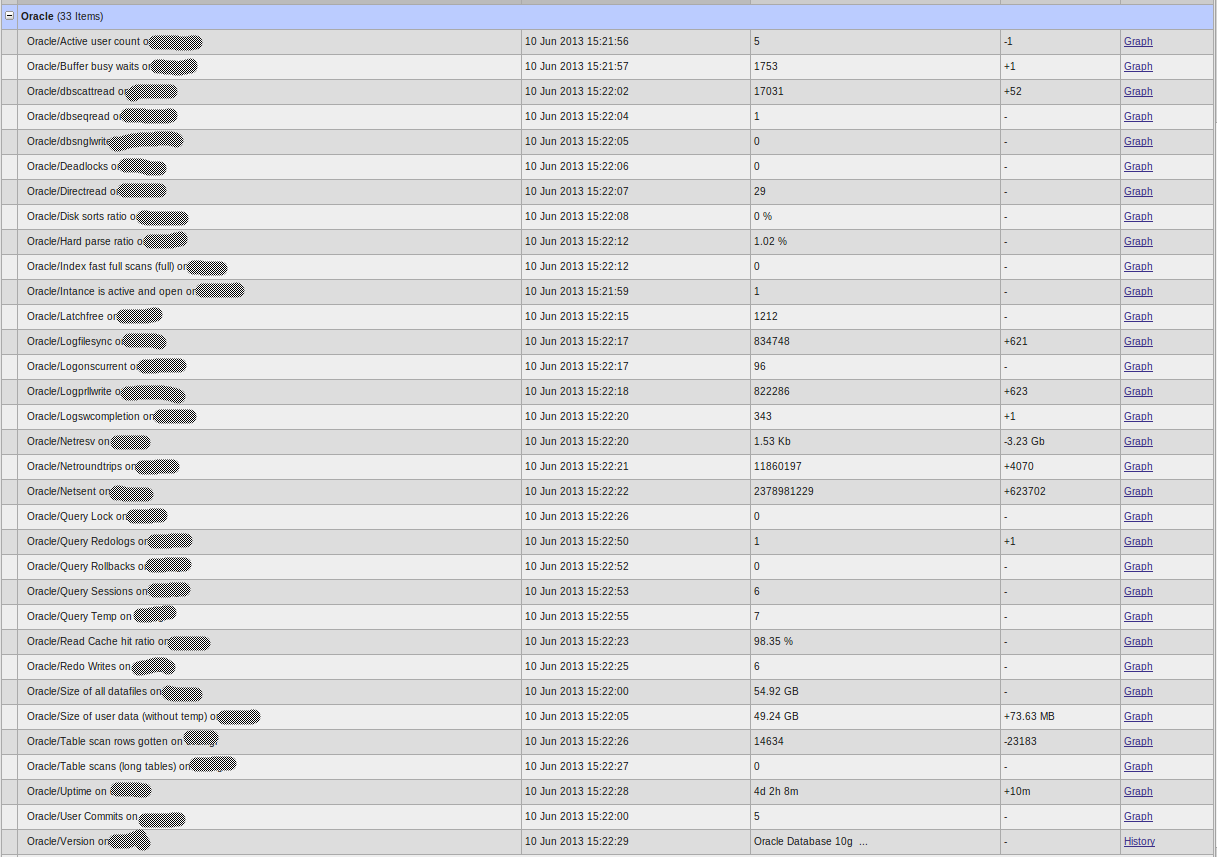
Remember that the tablespace discovery take one hour to complete.
The template still need some stuff but for now it works, if you have any question or want to contributed feel free to comment or send a pull over github. :)