I’m using InfluxDB a lot lately, InfluxDB is a time-series database written in Go. InfluxDB is easy to setup and to use, it comes with a CLI like MySQL for example and the commands are very similar, also, you have a web UI to make things even easier.
If you want to develop applications using InfluxDB there is a ton of client libraries(Go, Python, Java, Ruby, etc.) too. In this tutorial we are going use InfluxDB 0.9.5.1, write some data using Python3 and create a dashboard of these data on Grafana. The integration with Grafana is fantastic.
If you are interested in learning more about InfluxDB, check out the documentation: https://influxdb.com/docs/v0.9/introduction/getting_started.html
Install InfluxDB
I created a docker container for this using latest ubuntu, the installation is pretty straight forward:
wget https://s3.amazonaws.com/influxdb/influxdb_0.9.5.1_amd64.deb
sudo dpkg -i influxdb_0.9.5.1_amd64.deb

/etc/init.d/influxdb start
Create the database metrics
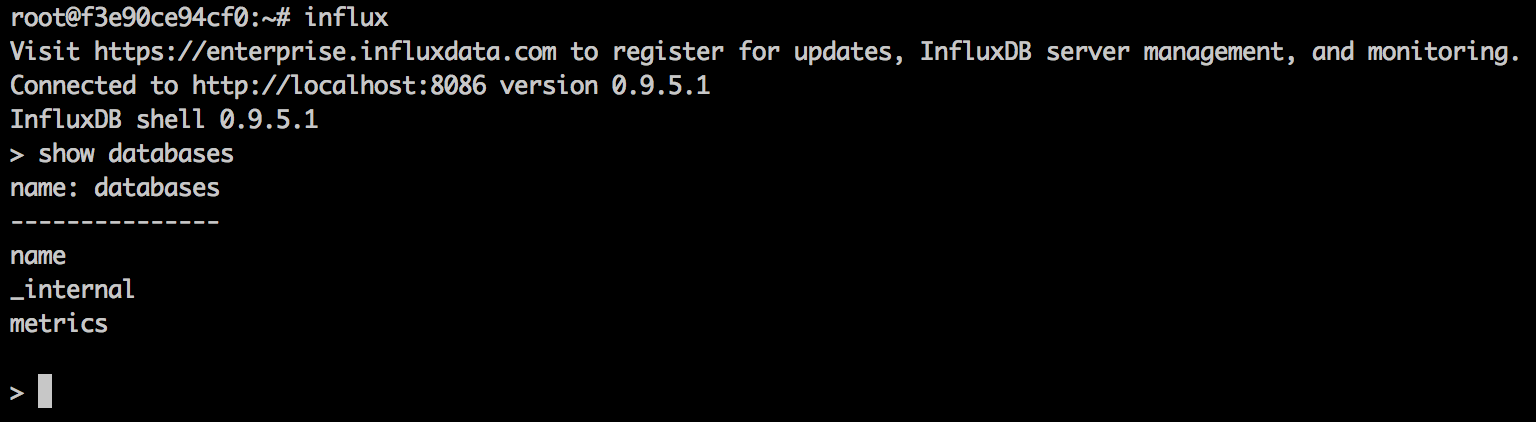
root@f3e90ce94cf0:/# influx
Visit https://enterprise.influxdata.com to register for updates, InfluxDB server management, and monitoring.
Connected to http://localhost:8086 version 0.9.5.1
InfluxDB shell 0.9.5.1
> CREATE DATABASE metrics;
>
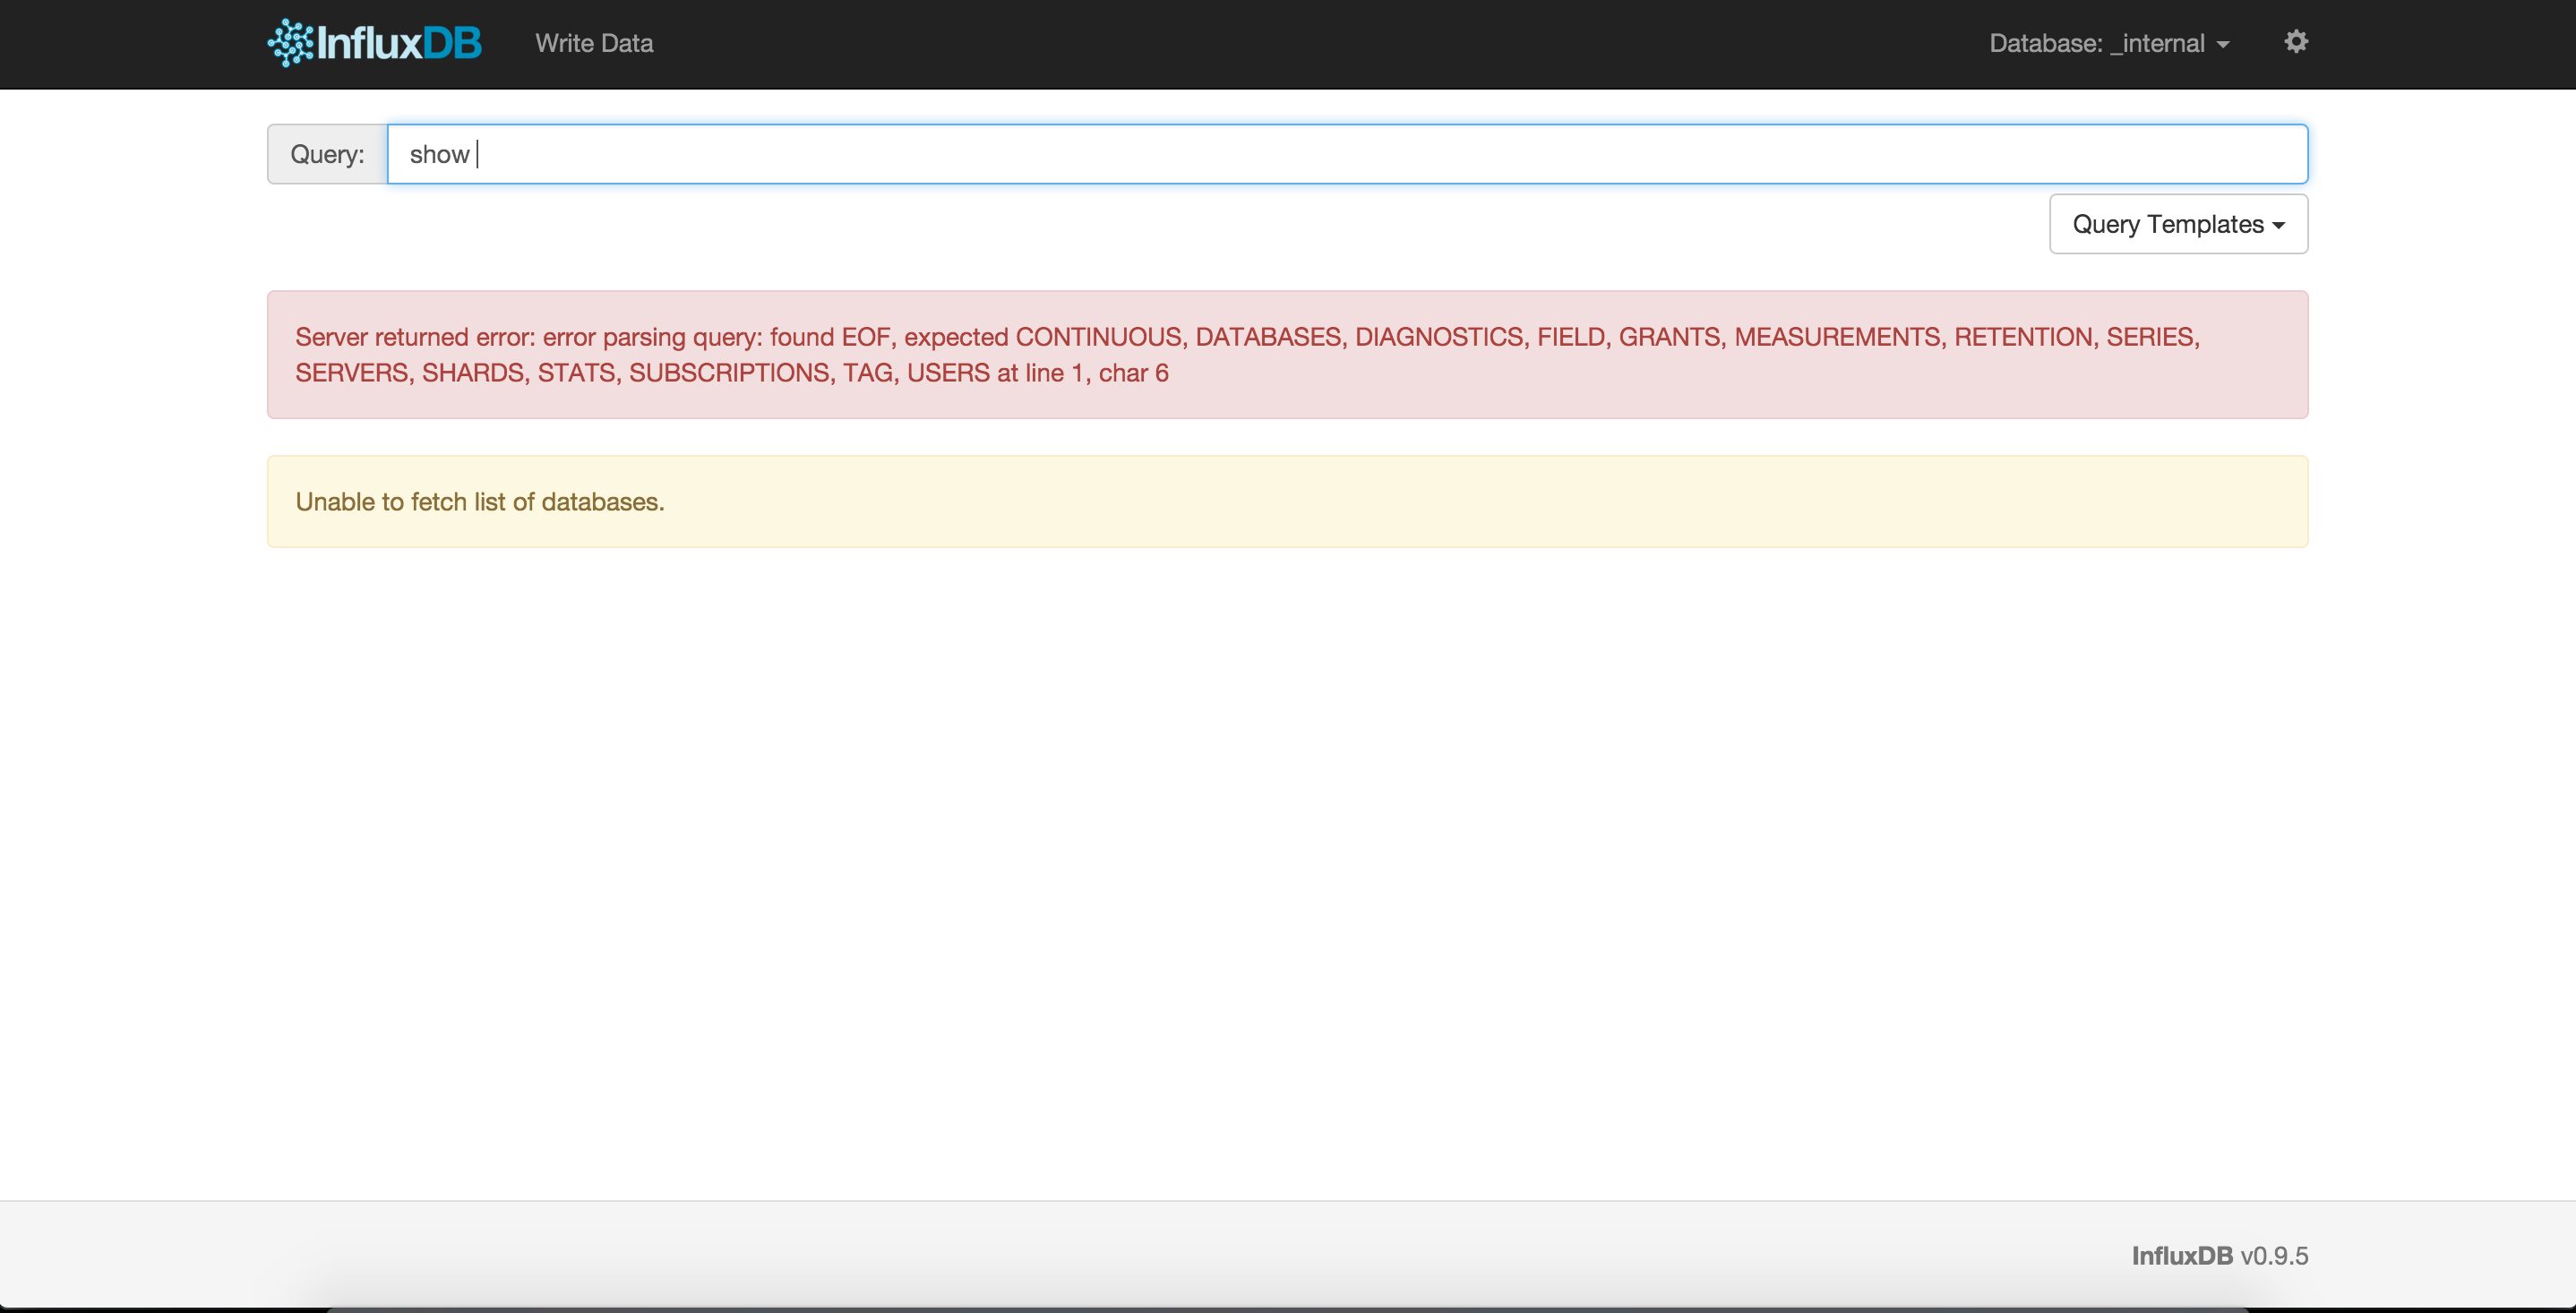
Below screenshots of the CLI and Web UI.
Populate the database with data
We are going use Python3 for this. Install python3-pip and influxdb library
apt-get install -y python3-pip
pip3 install influxdb
Check this gist https://gist.github.com/bicofino/4a73e40e8a0b62daceb9 It’s a simple script that connects to InfluxDB and write some data, in this case, cpu_load_short.
Run the code, the script takes around 5 minutes to run.
wget https://gist.githubusercontent.com/bicofino/4a73e40e8a0b62daceb9/raw/8b5722cfe8b20e6635c9b375ff121d7005a6e2ac/write_metrics.py
python3 write_metrics.py
Install Grafana
Grafana is a application for visualizing data. It’s very elegant to create dashboards and have support for InfluxDB. For more information http://docs.grafana.org/
apt-get update
apt-get upgrade -y
wget https://grafanarel.s3.amazonaws.com/builds/grafana_2.5.0_amd64.deb
sudo dpkg -i grafana_2.5.0_amd64.deb

/etc/init.d/grafana-server start
Now you can access on the browser http://localhost:3000, the default port is 3000 but you can change on it’s configuration file /etc/grafana/grafana.ini
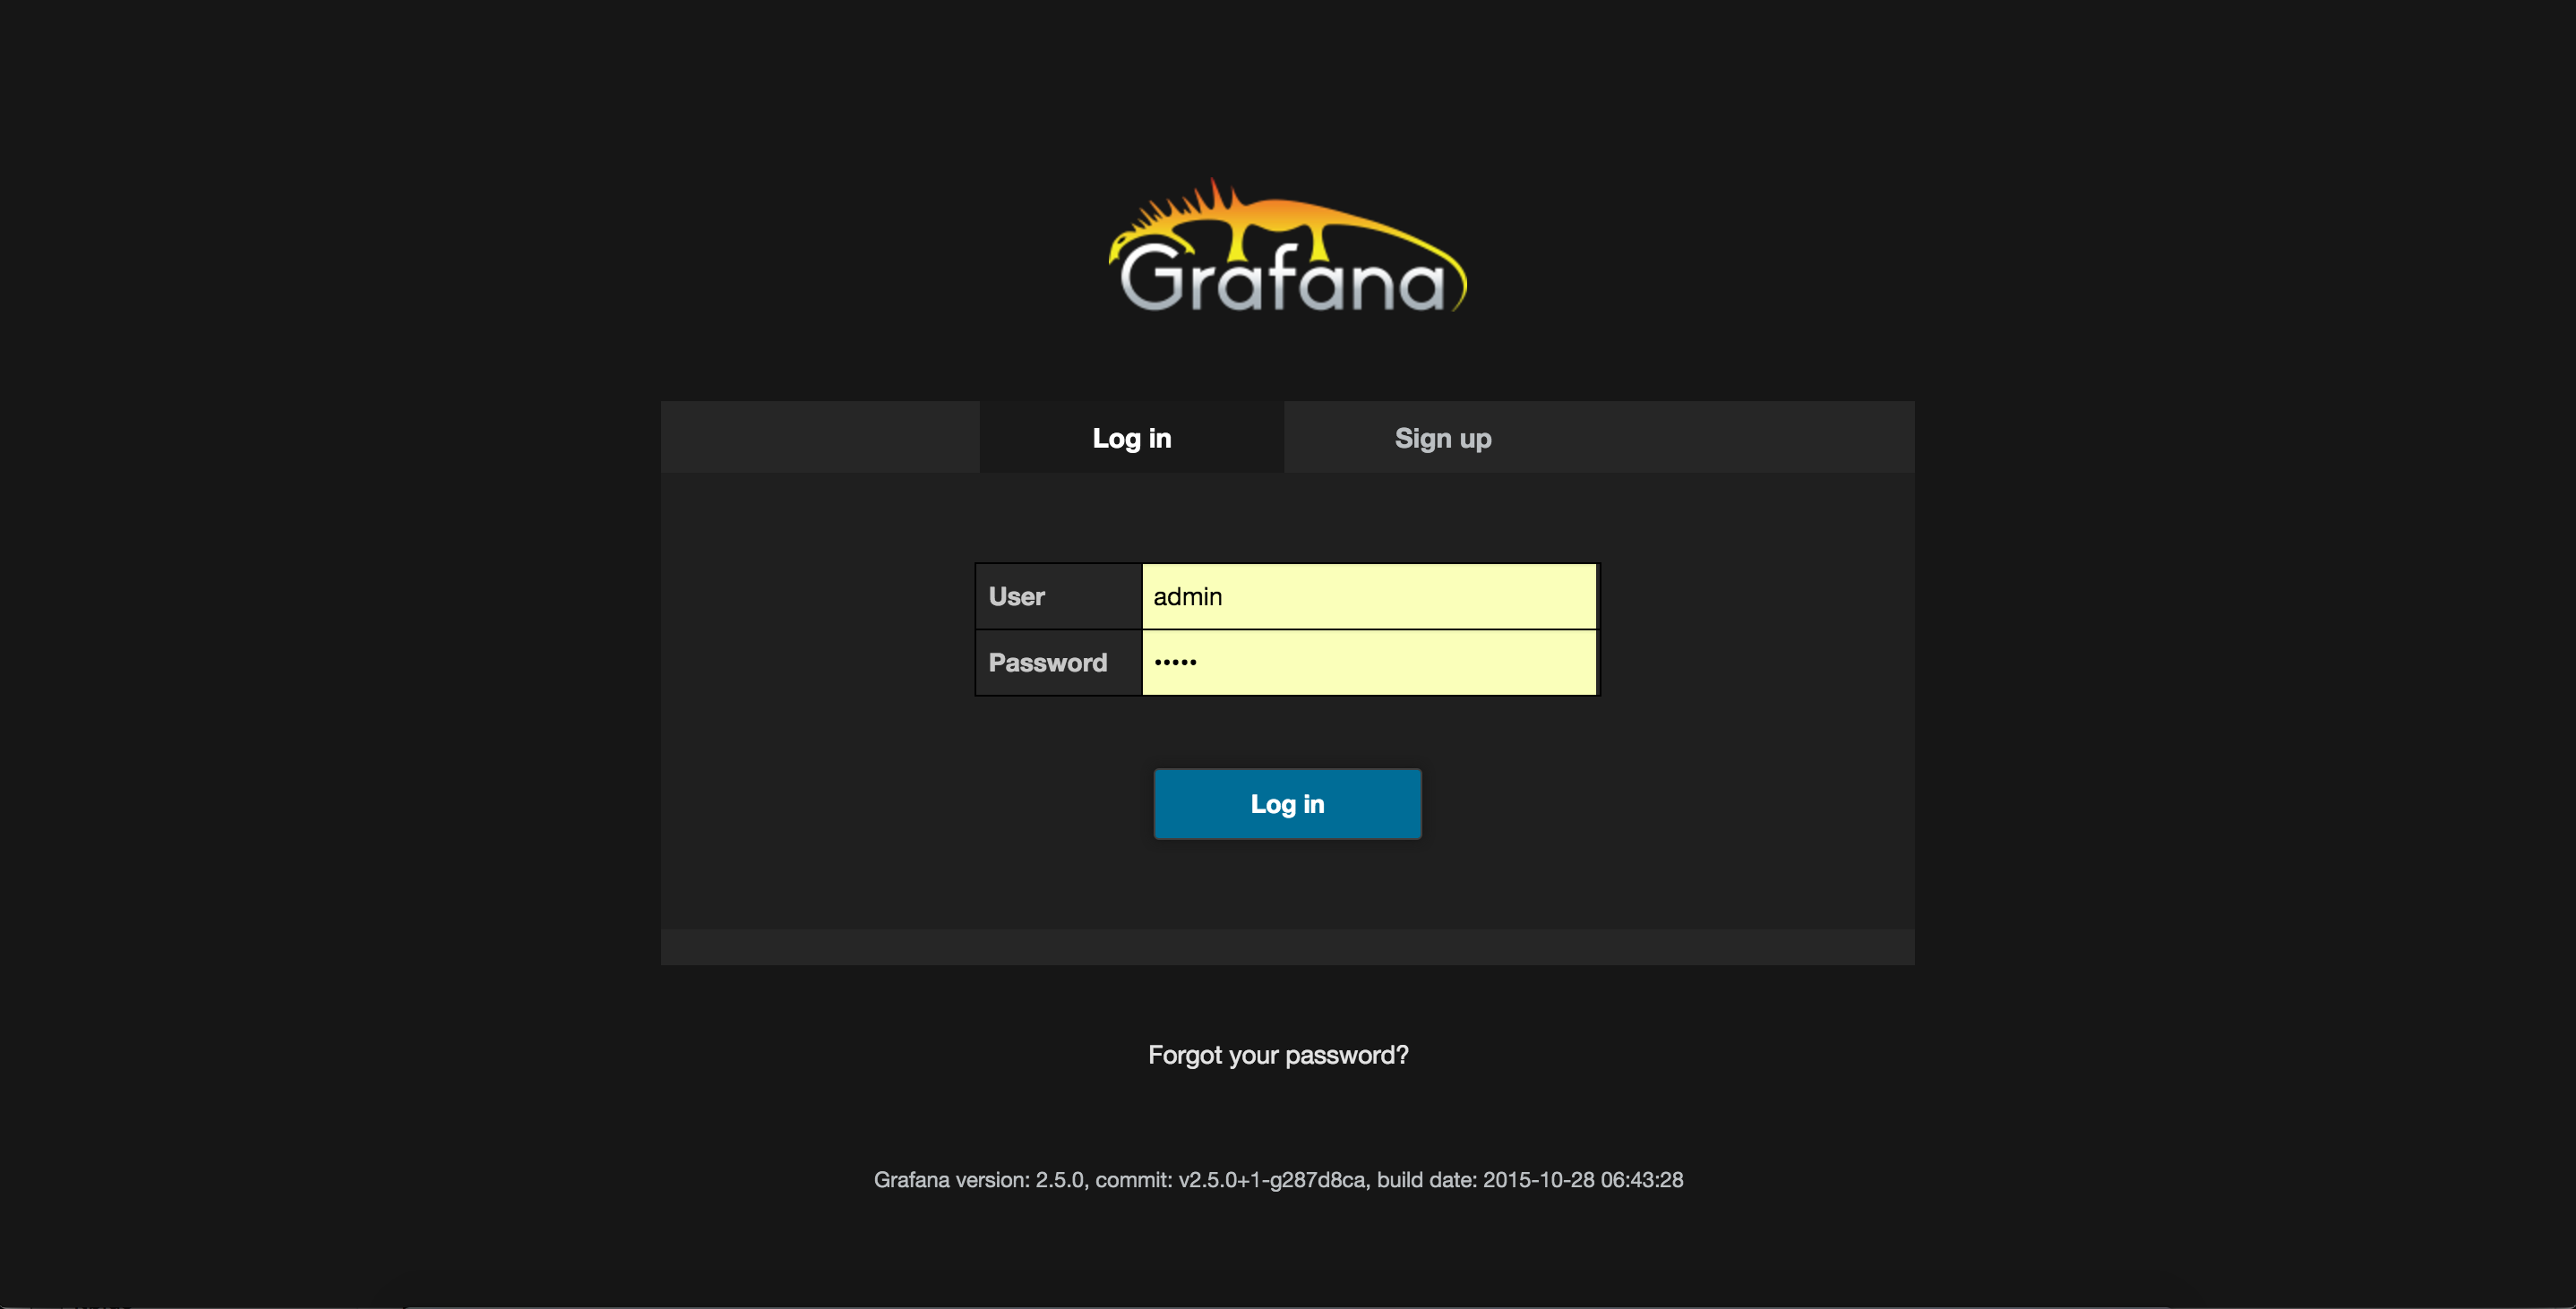
The default user/password is admin/admin.
The default user/password of InfluxDB is root/root.
After you login the process is very simple, you need to configure the Data Source to use InfluxDB, create a new dashboard and inside it you create a new graph using the series cpu_load_short.
Login using the default credentials(admin/admin)
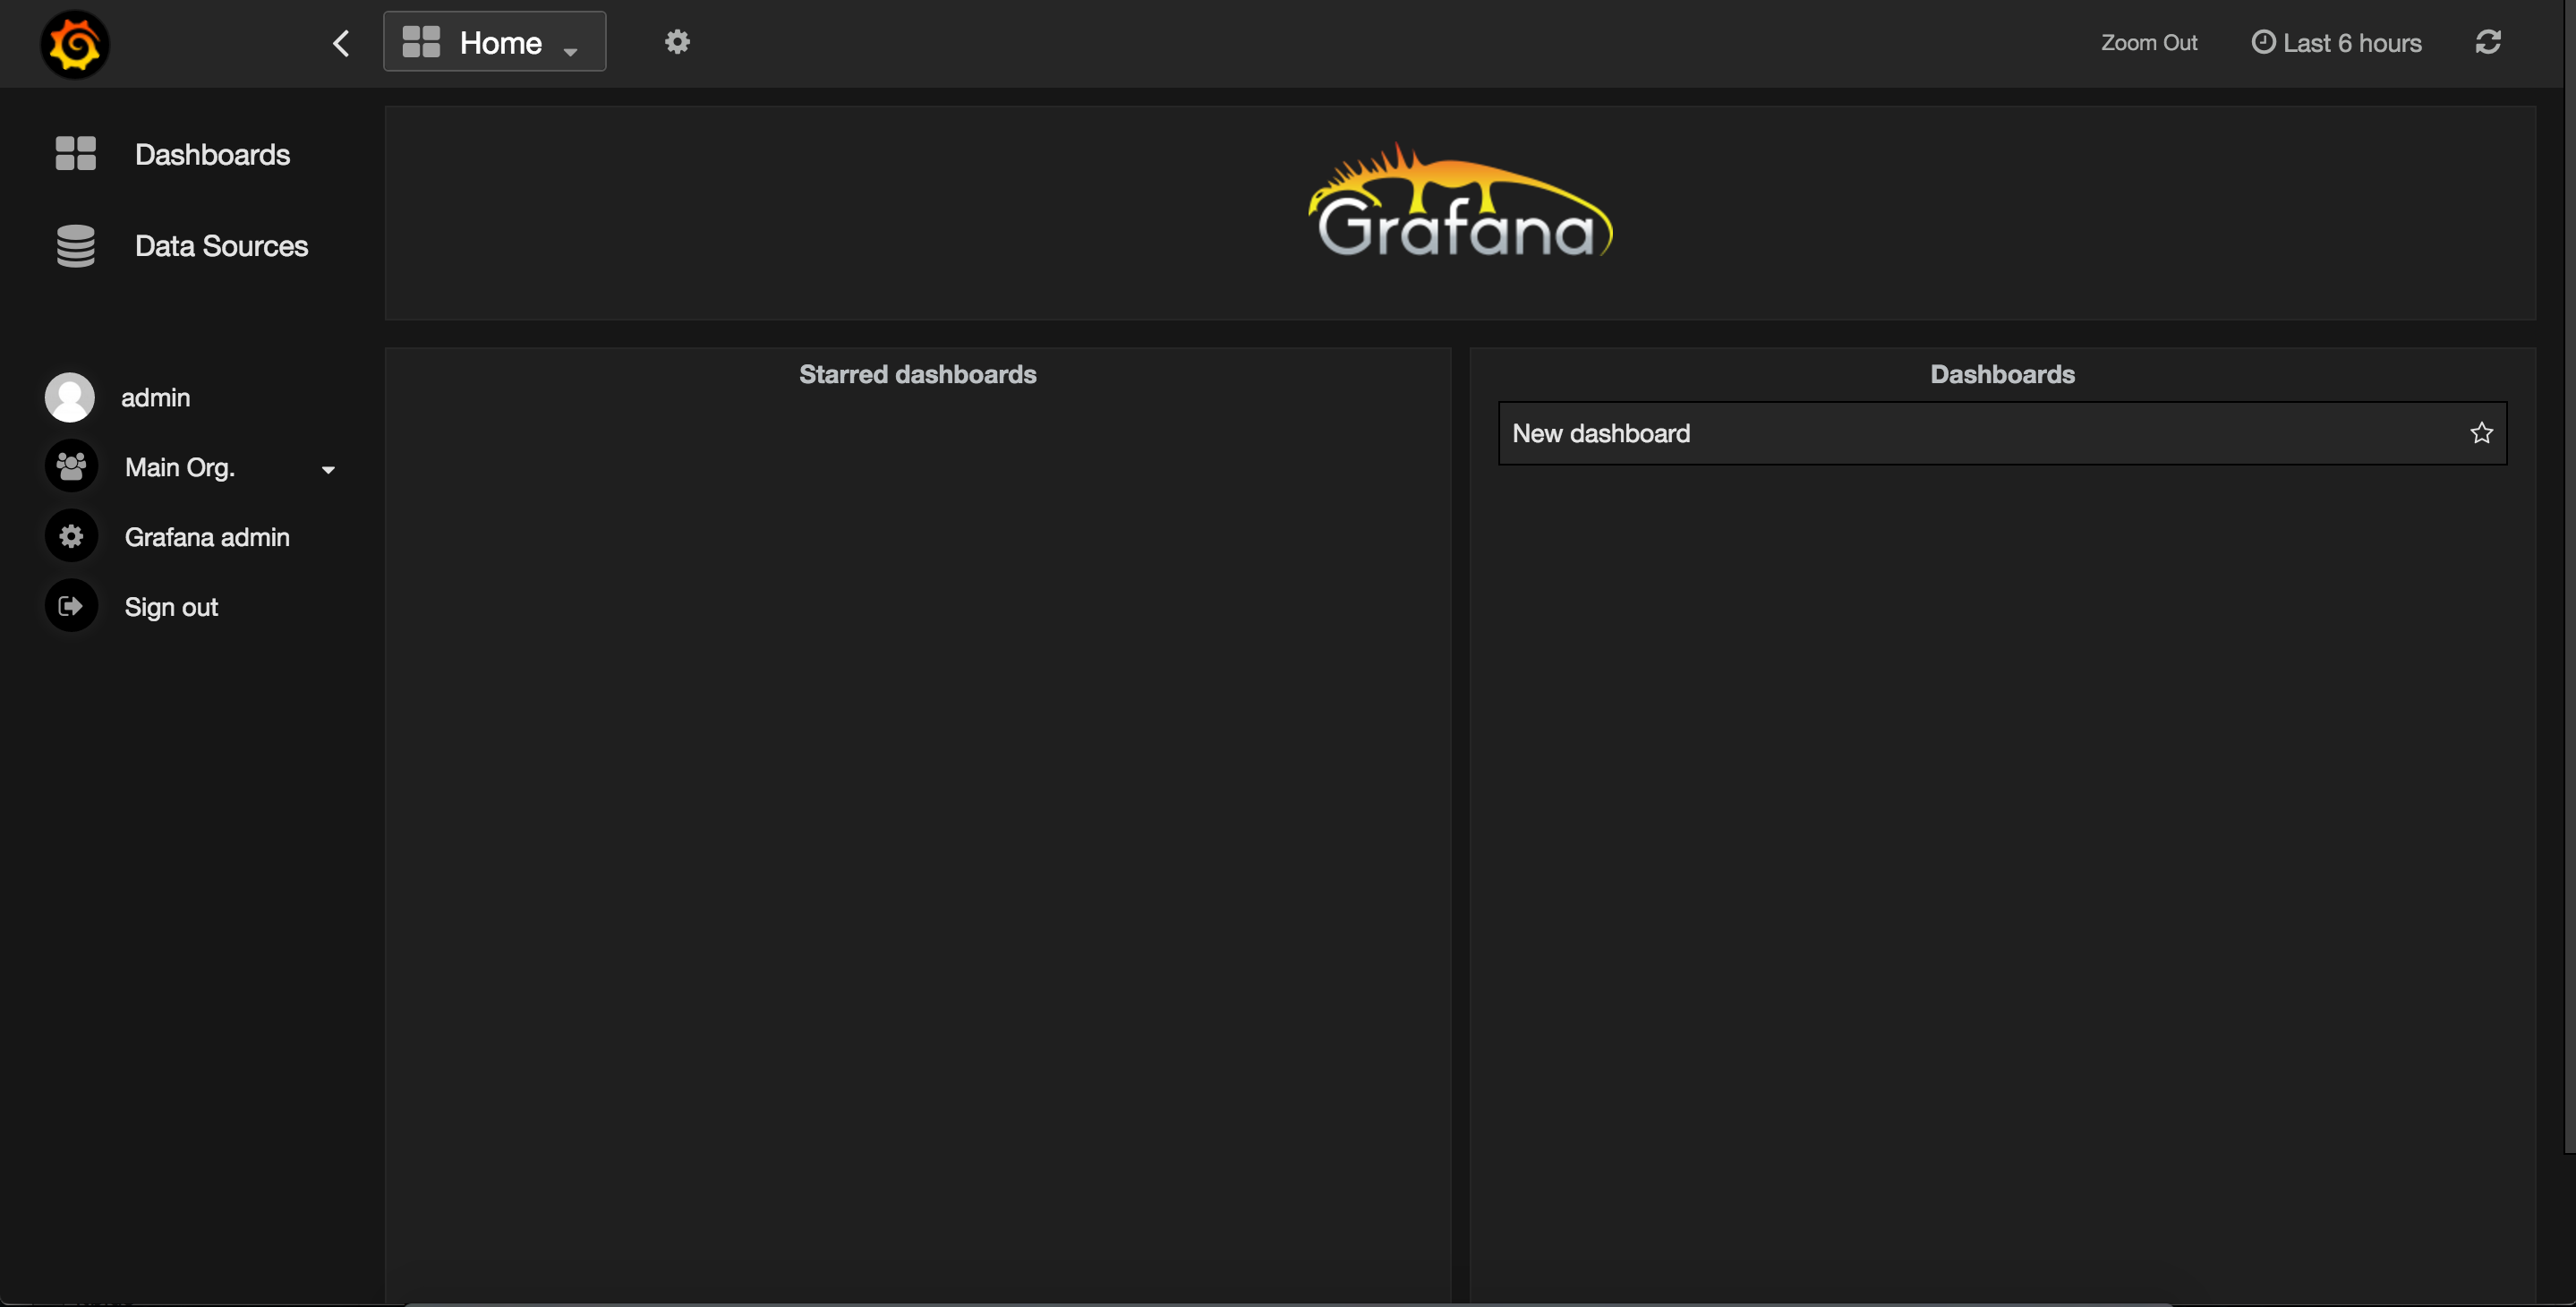
Screen after you login
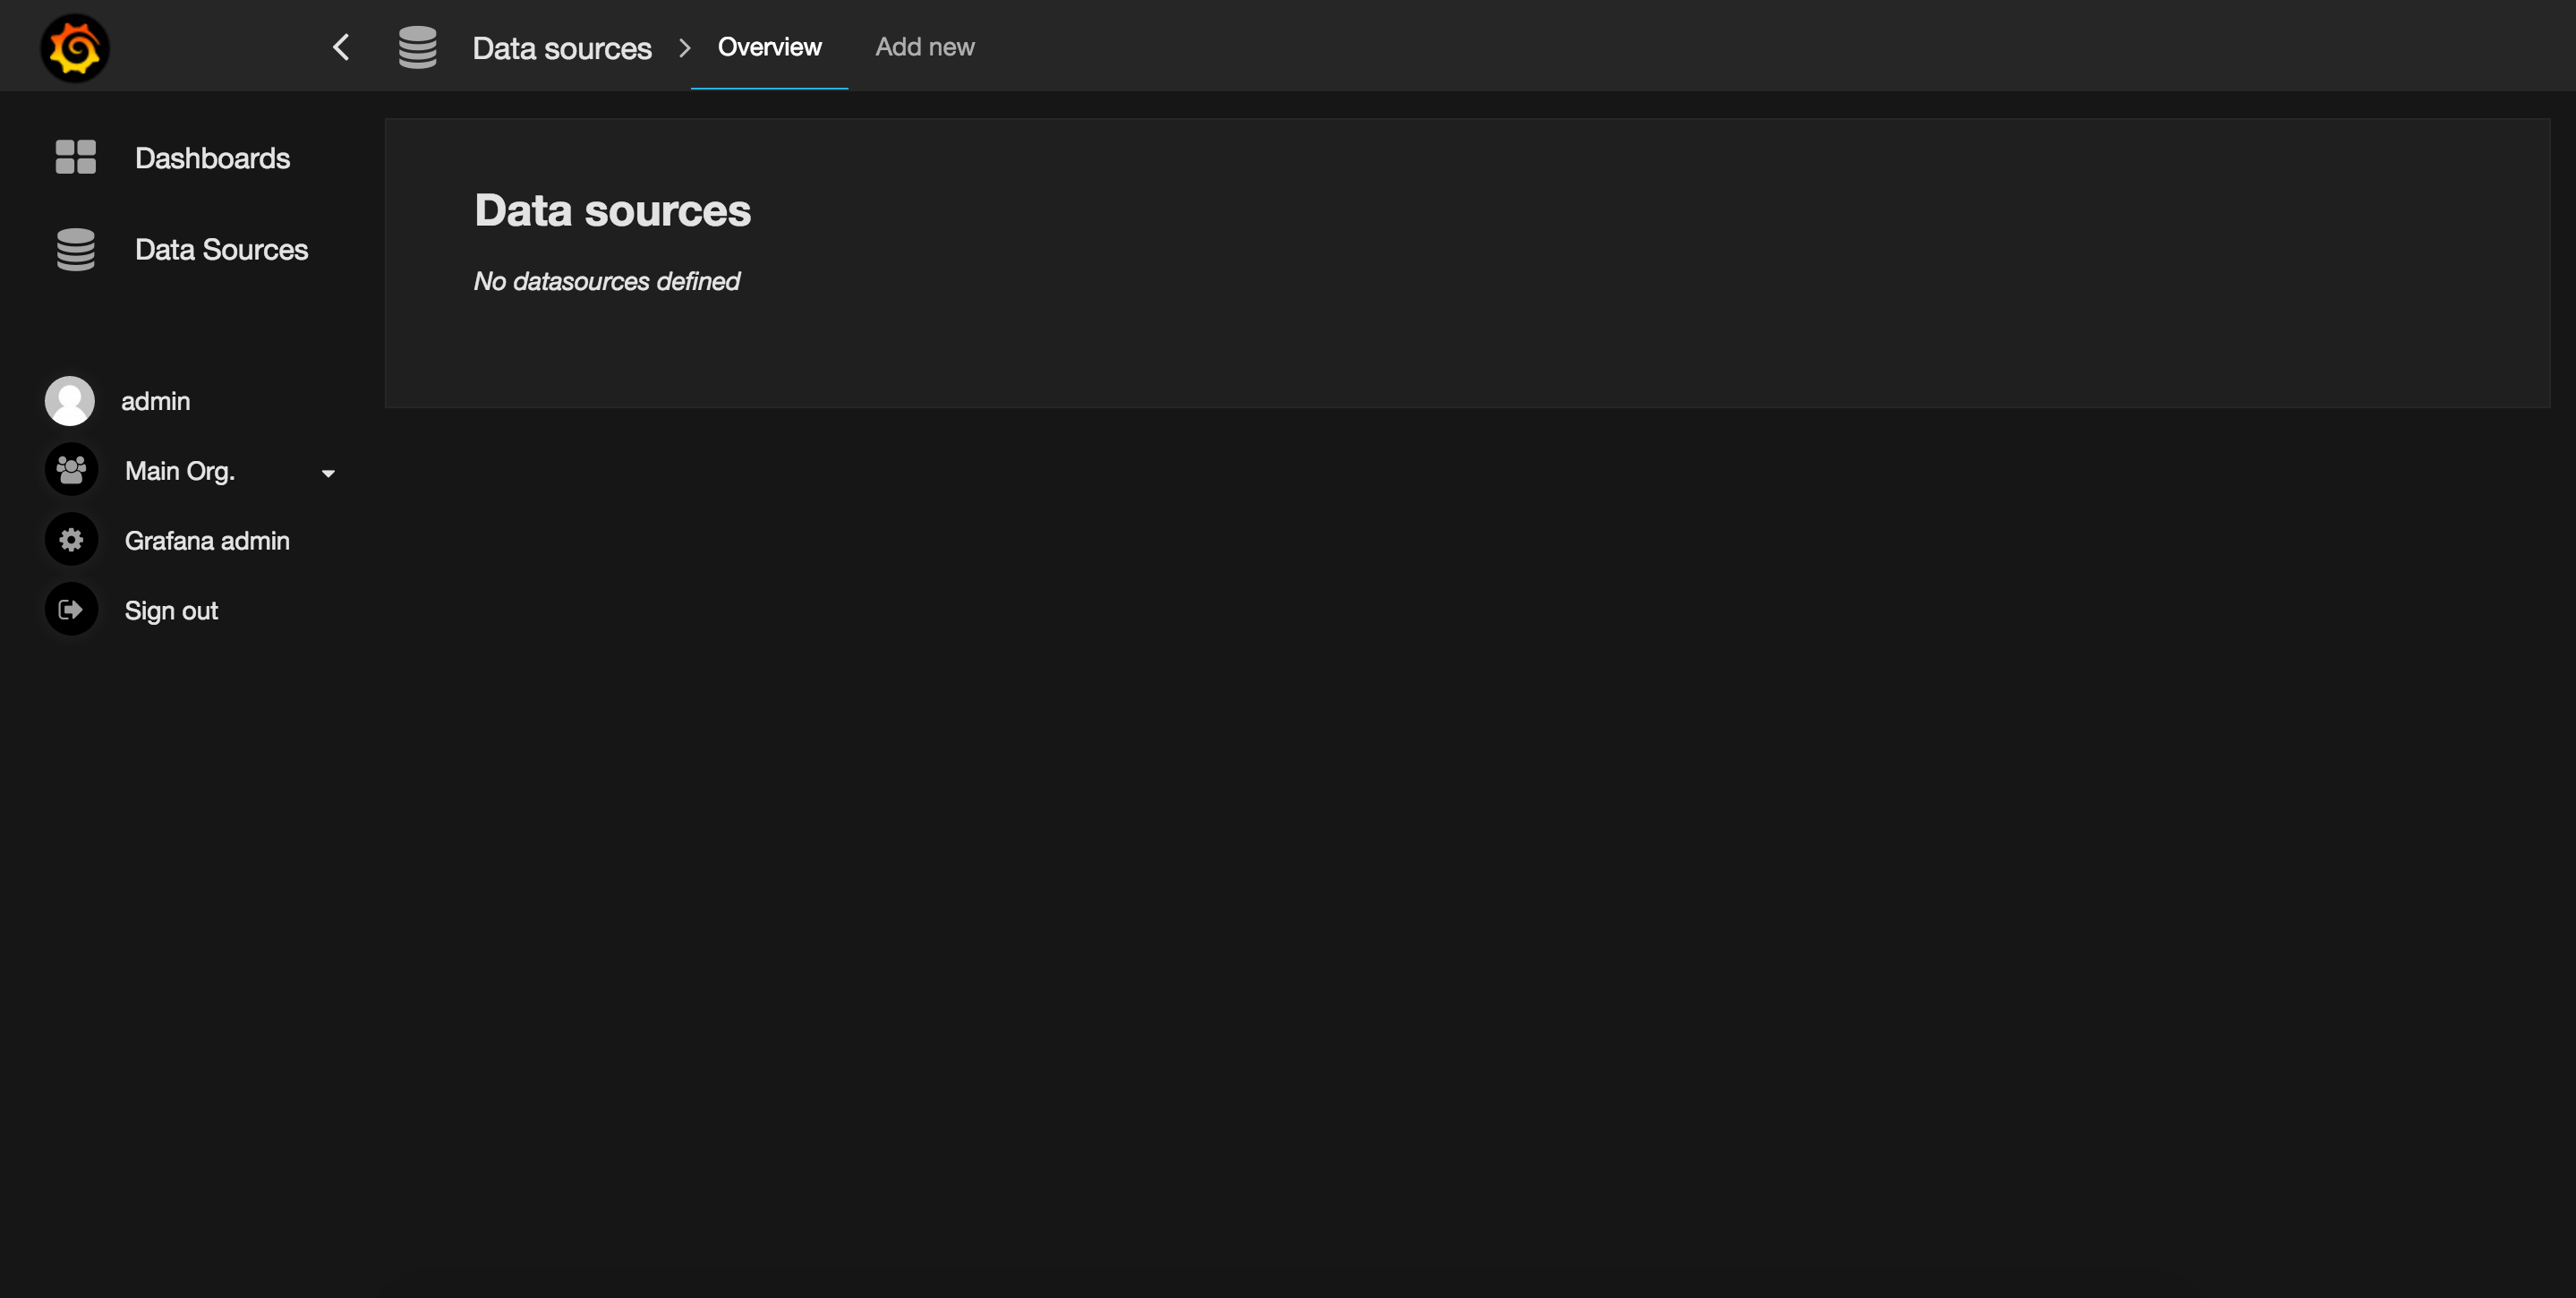
 Click on Data Sources link
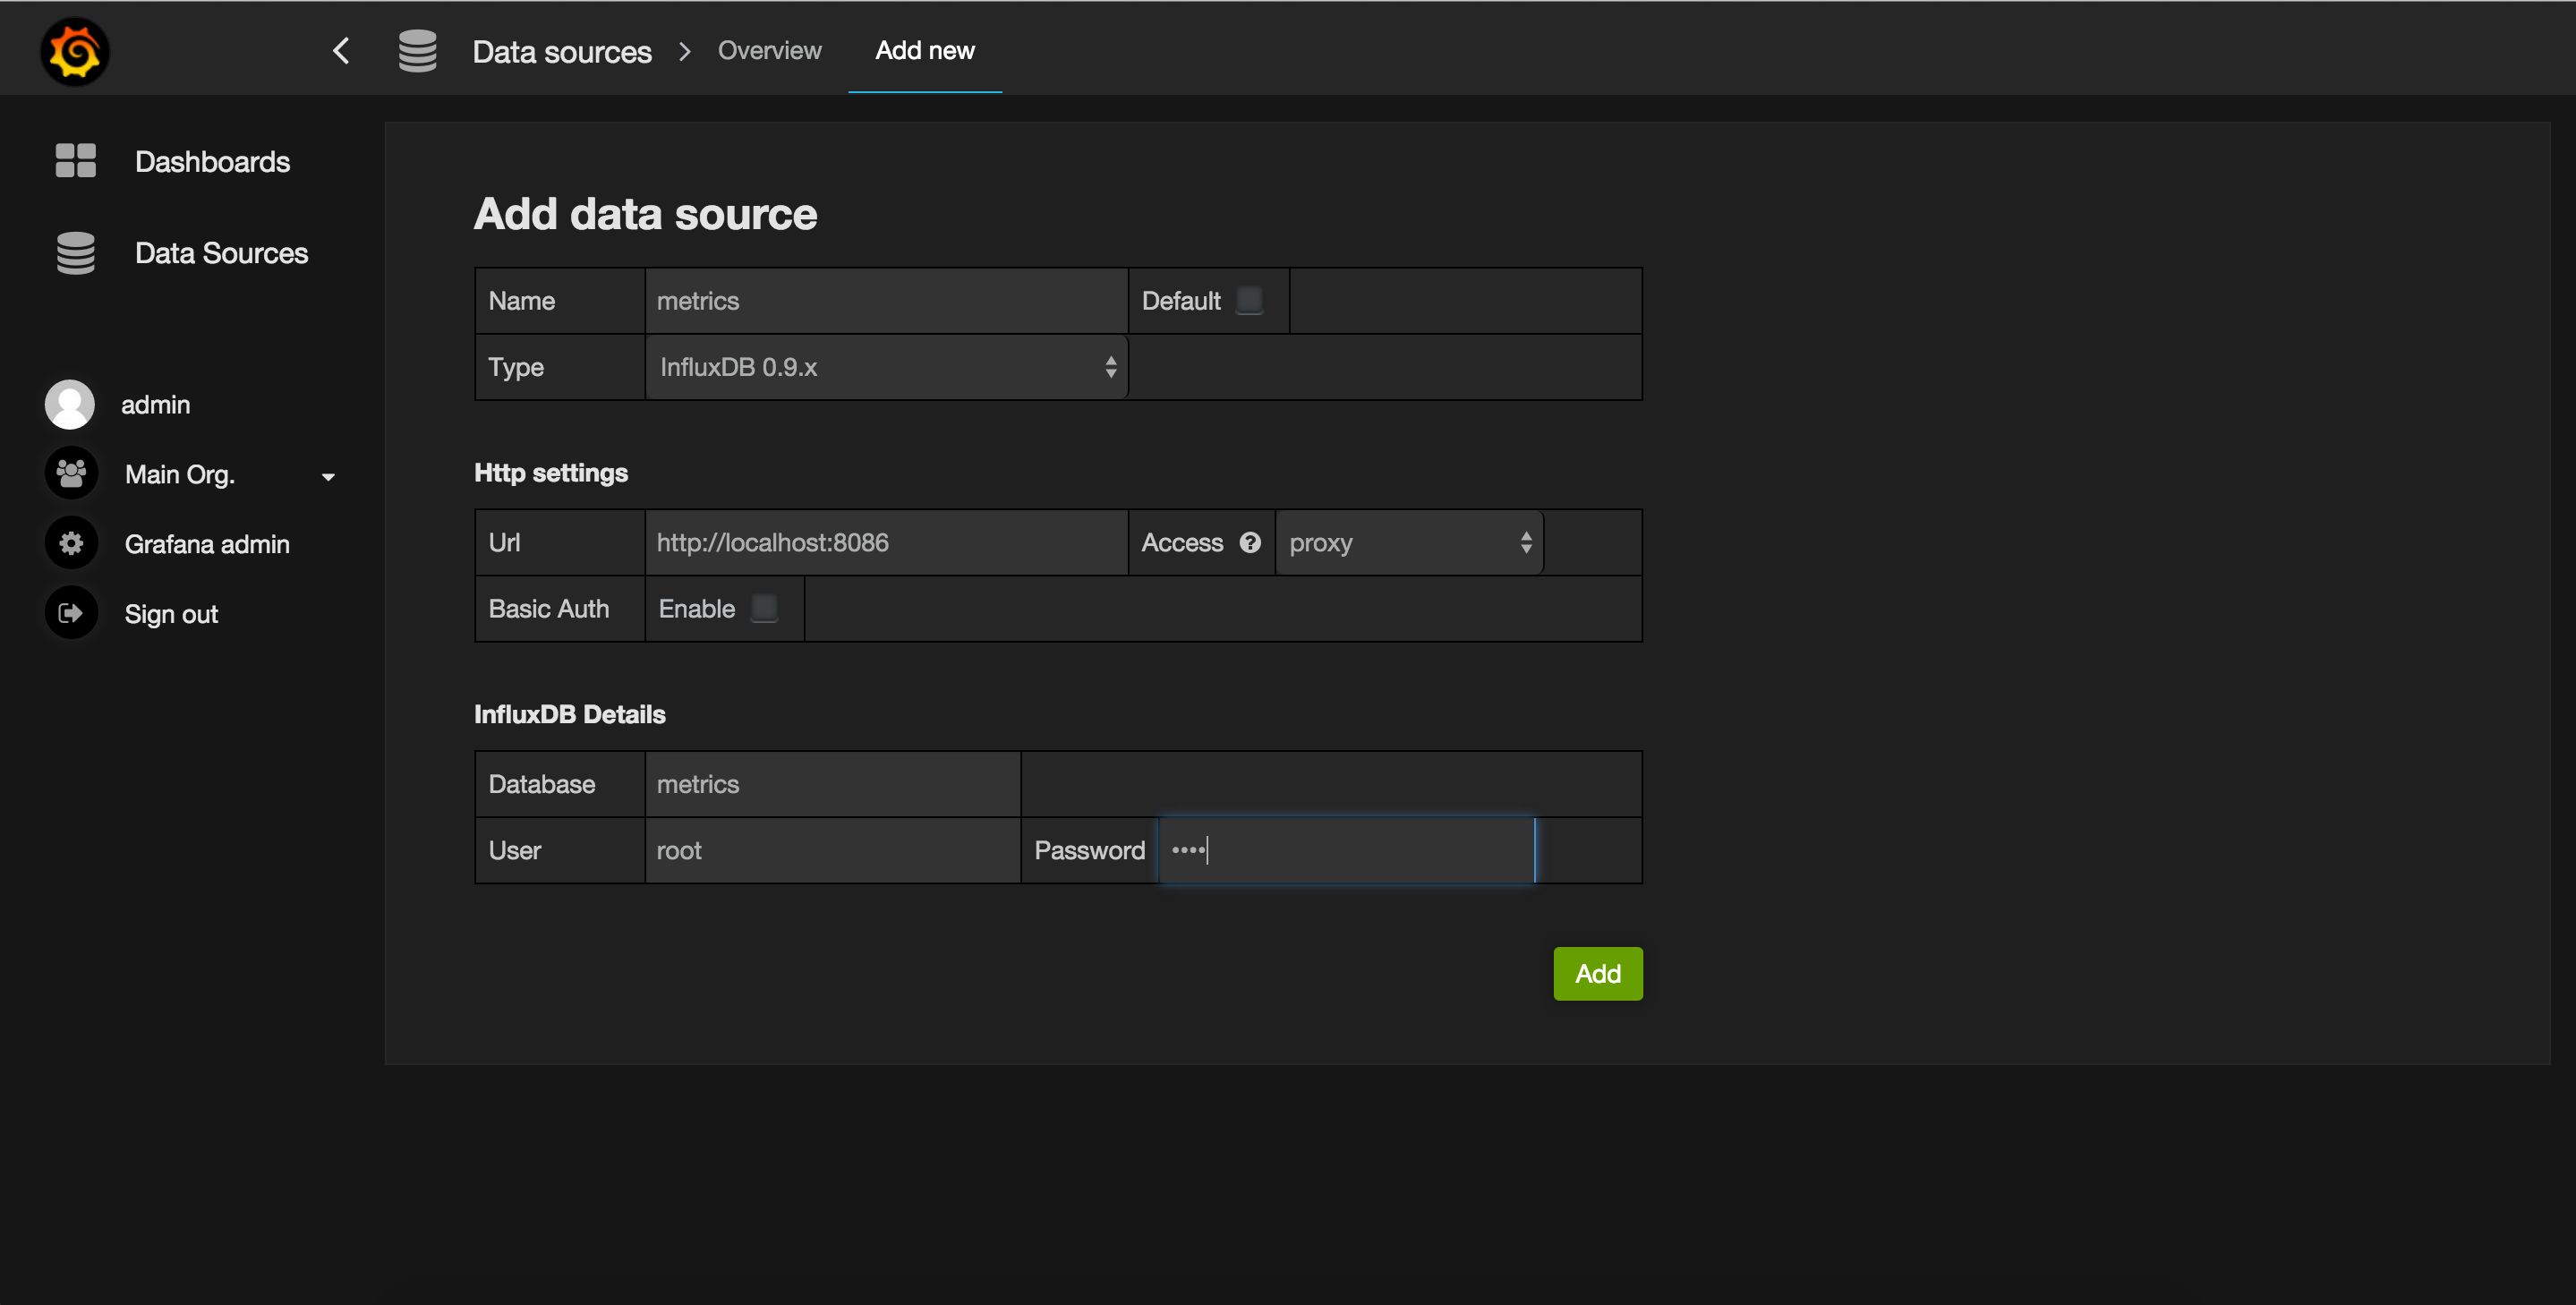
 Add the data source
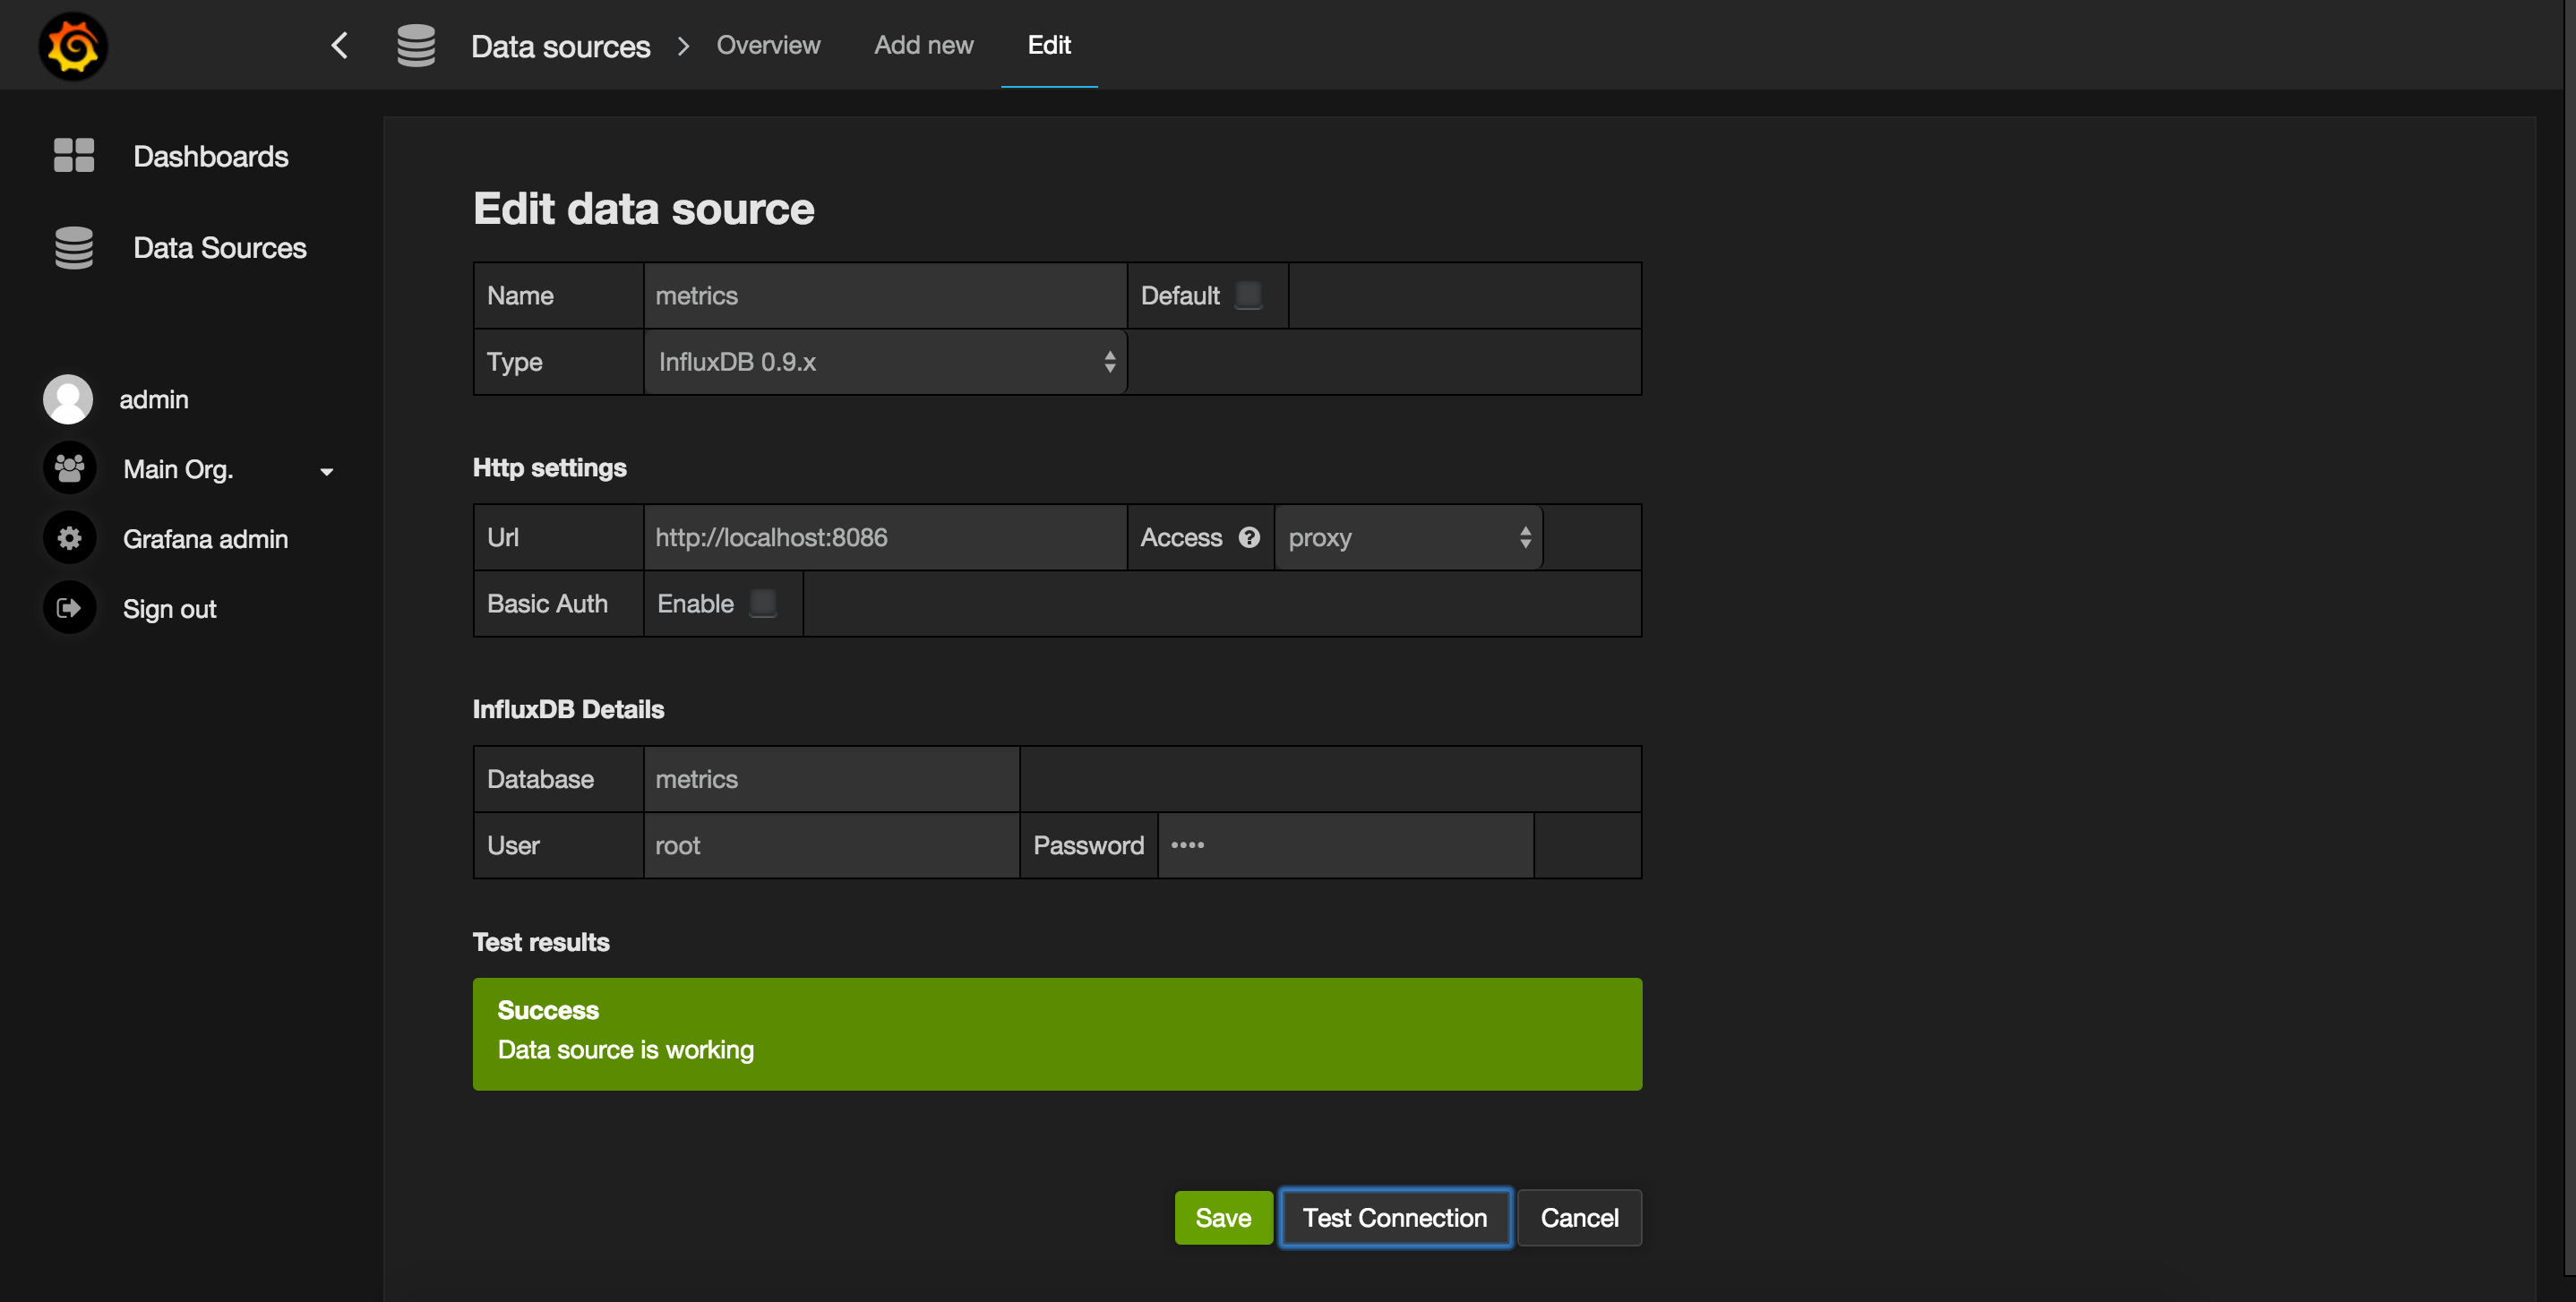
 Test the data source
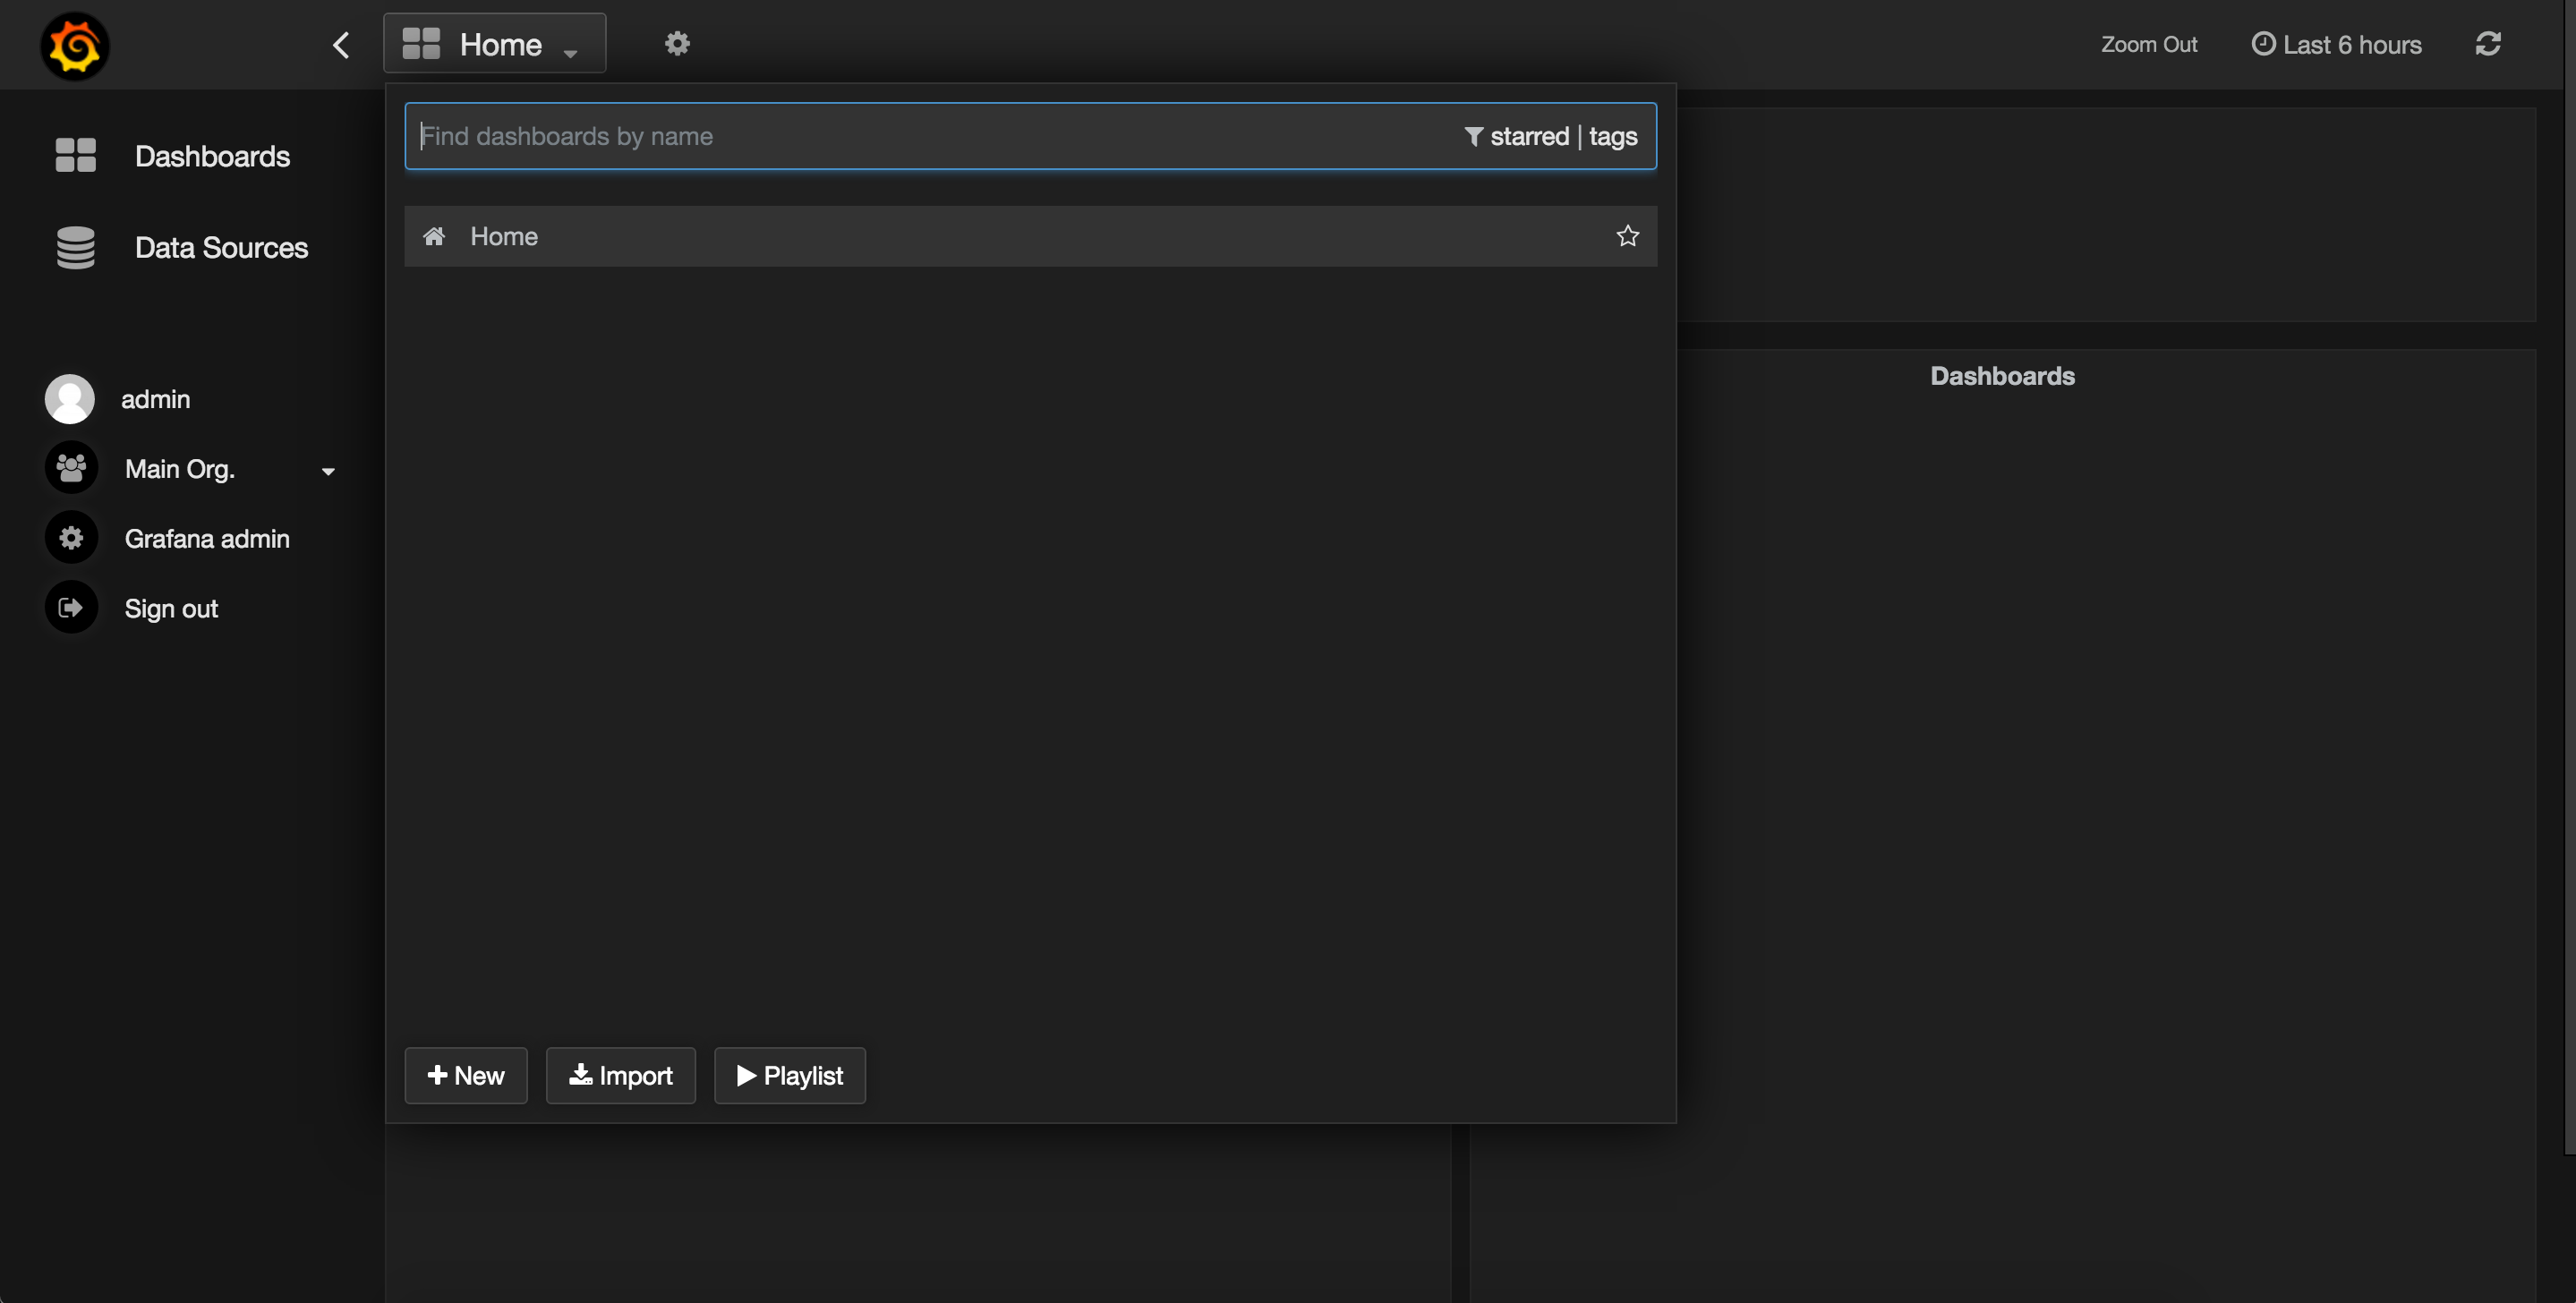
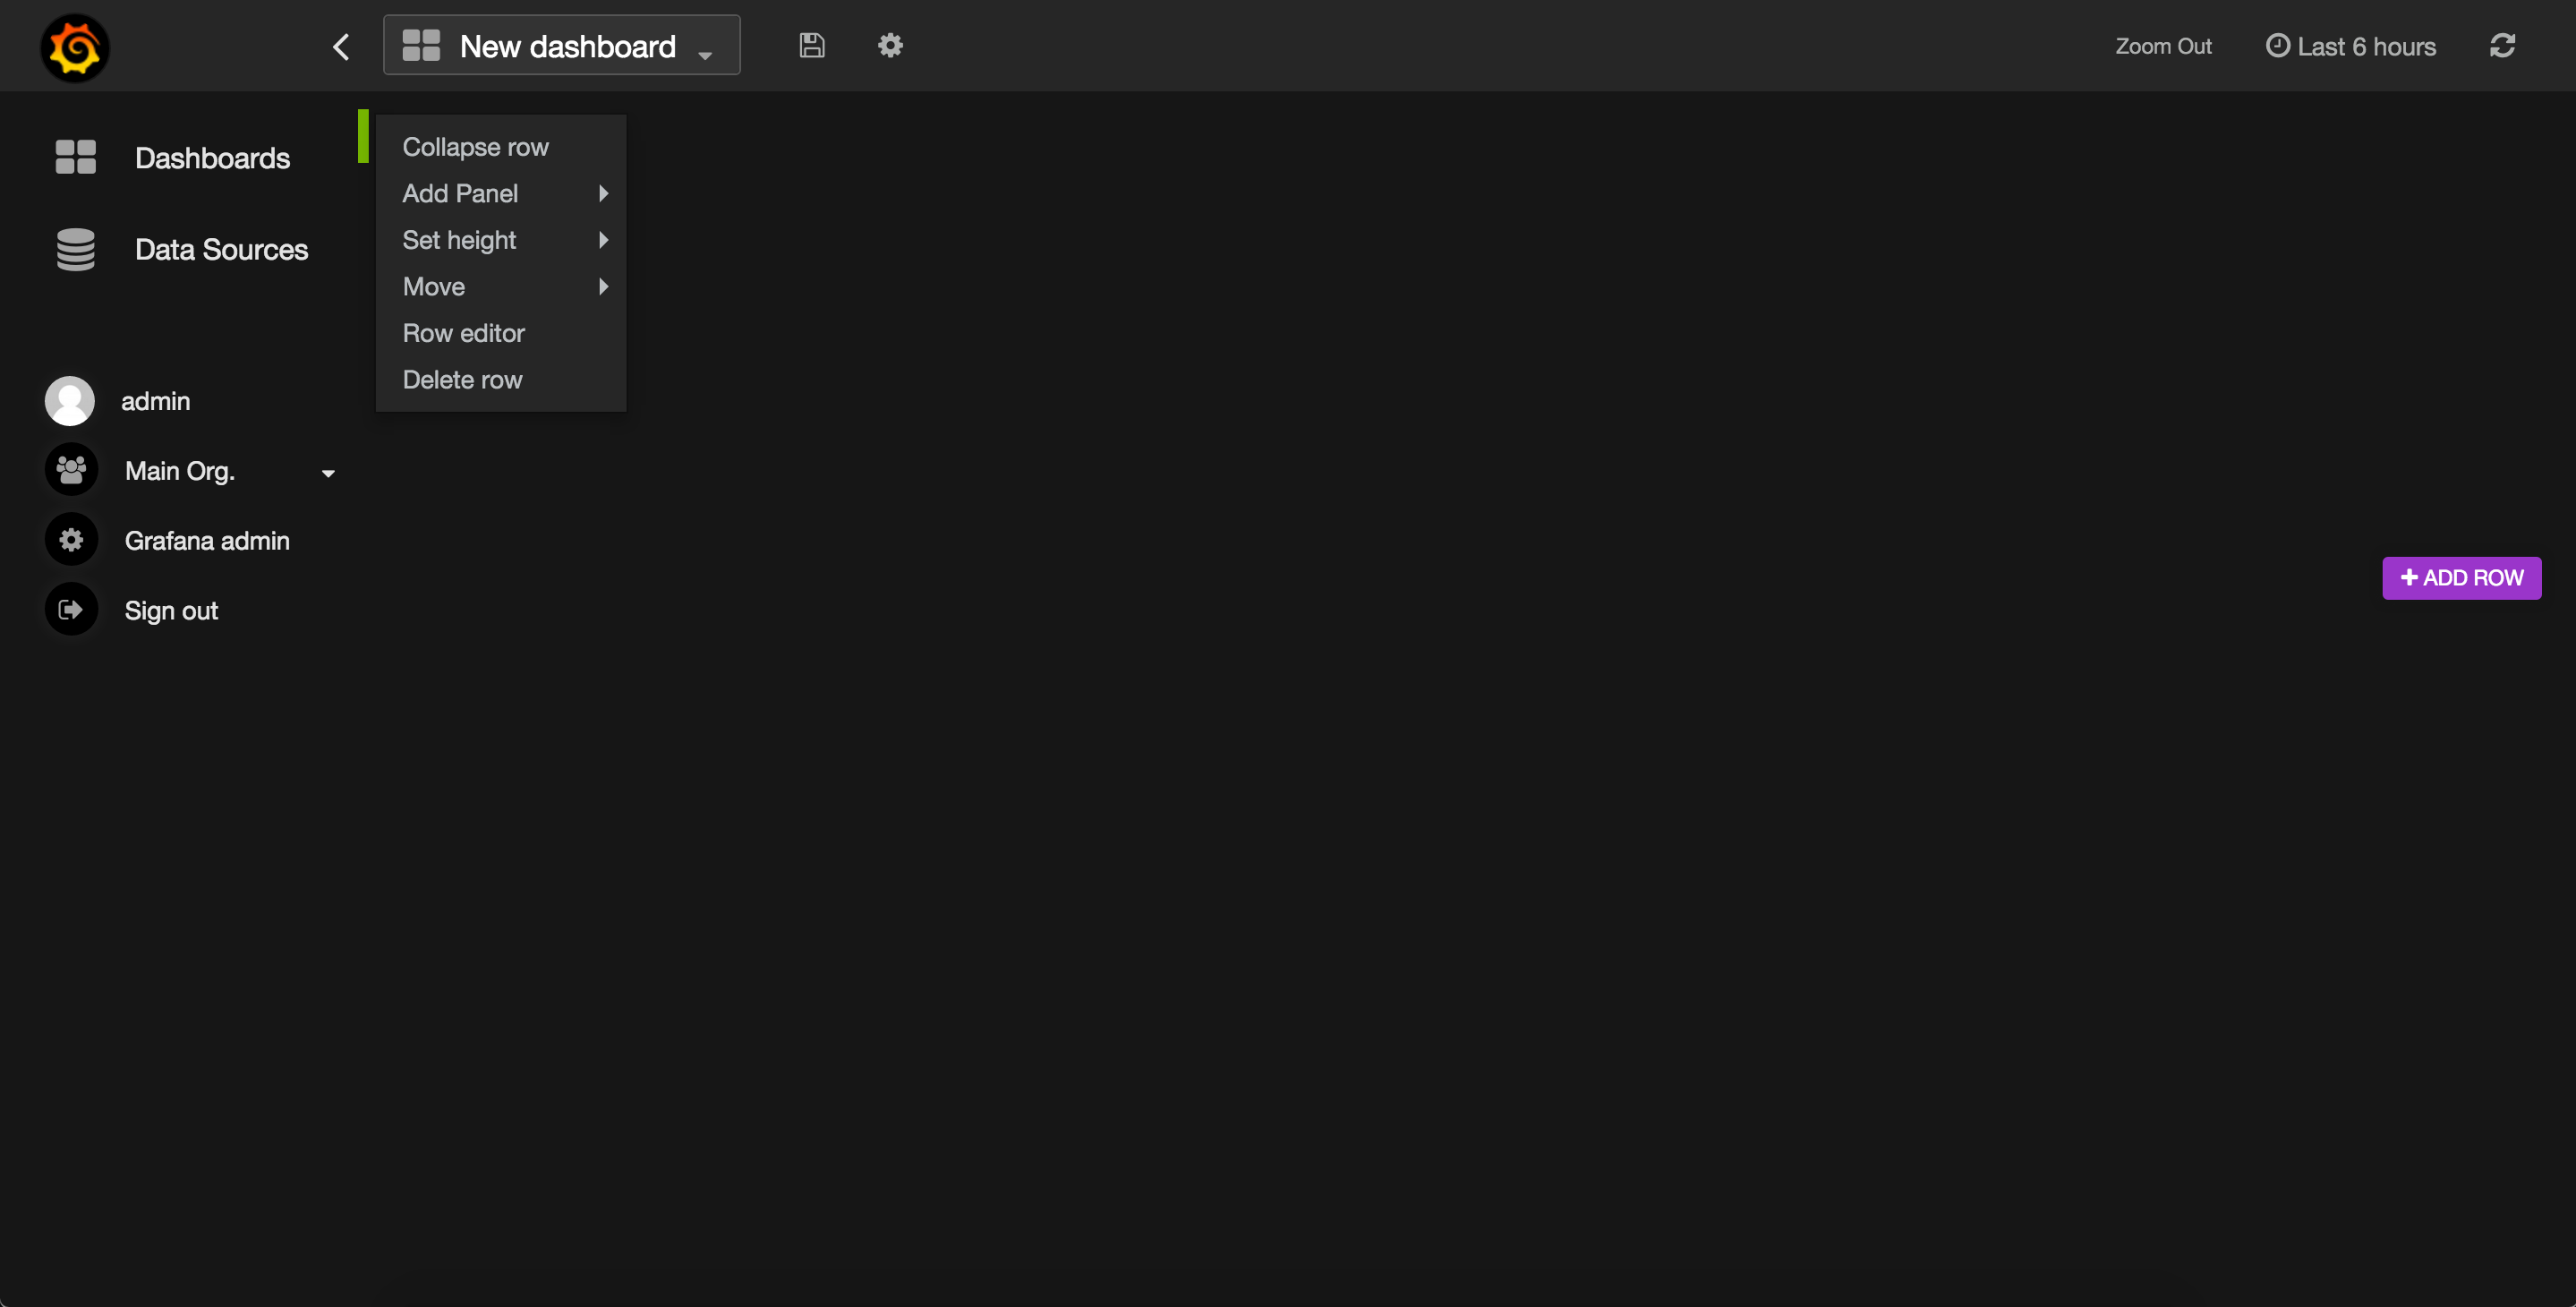
 Add a new dashboard
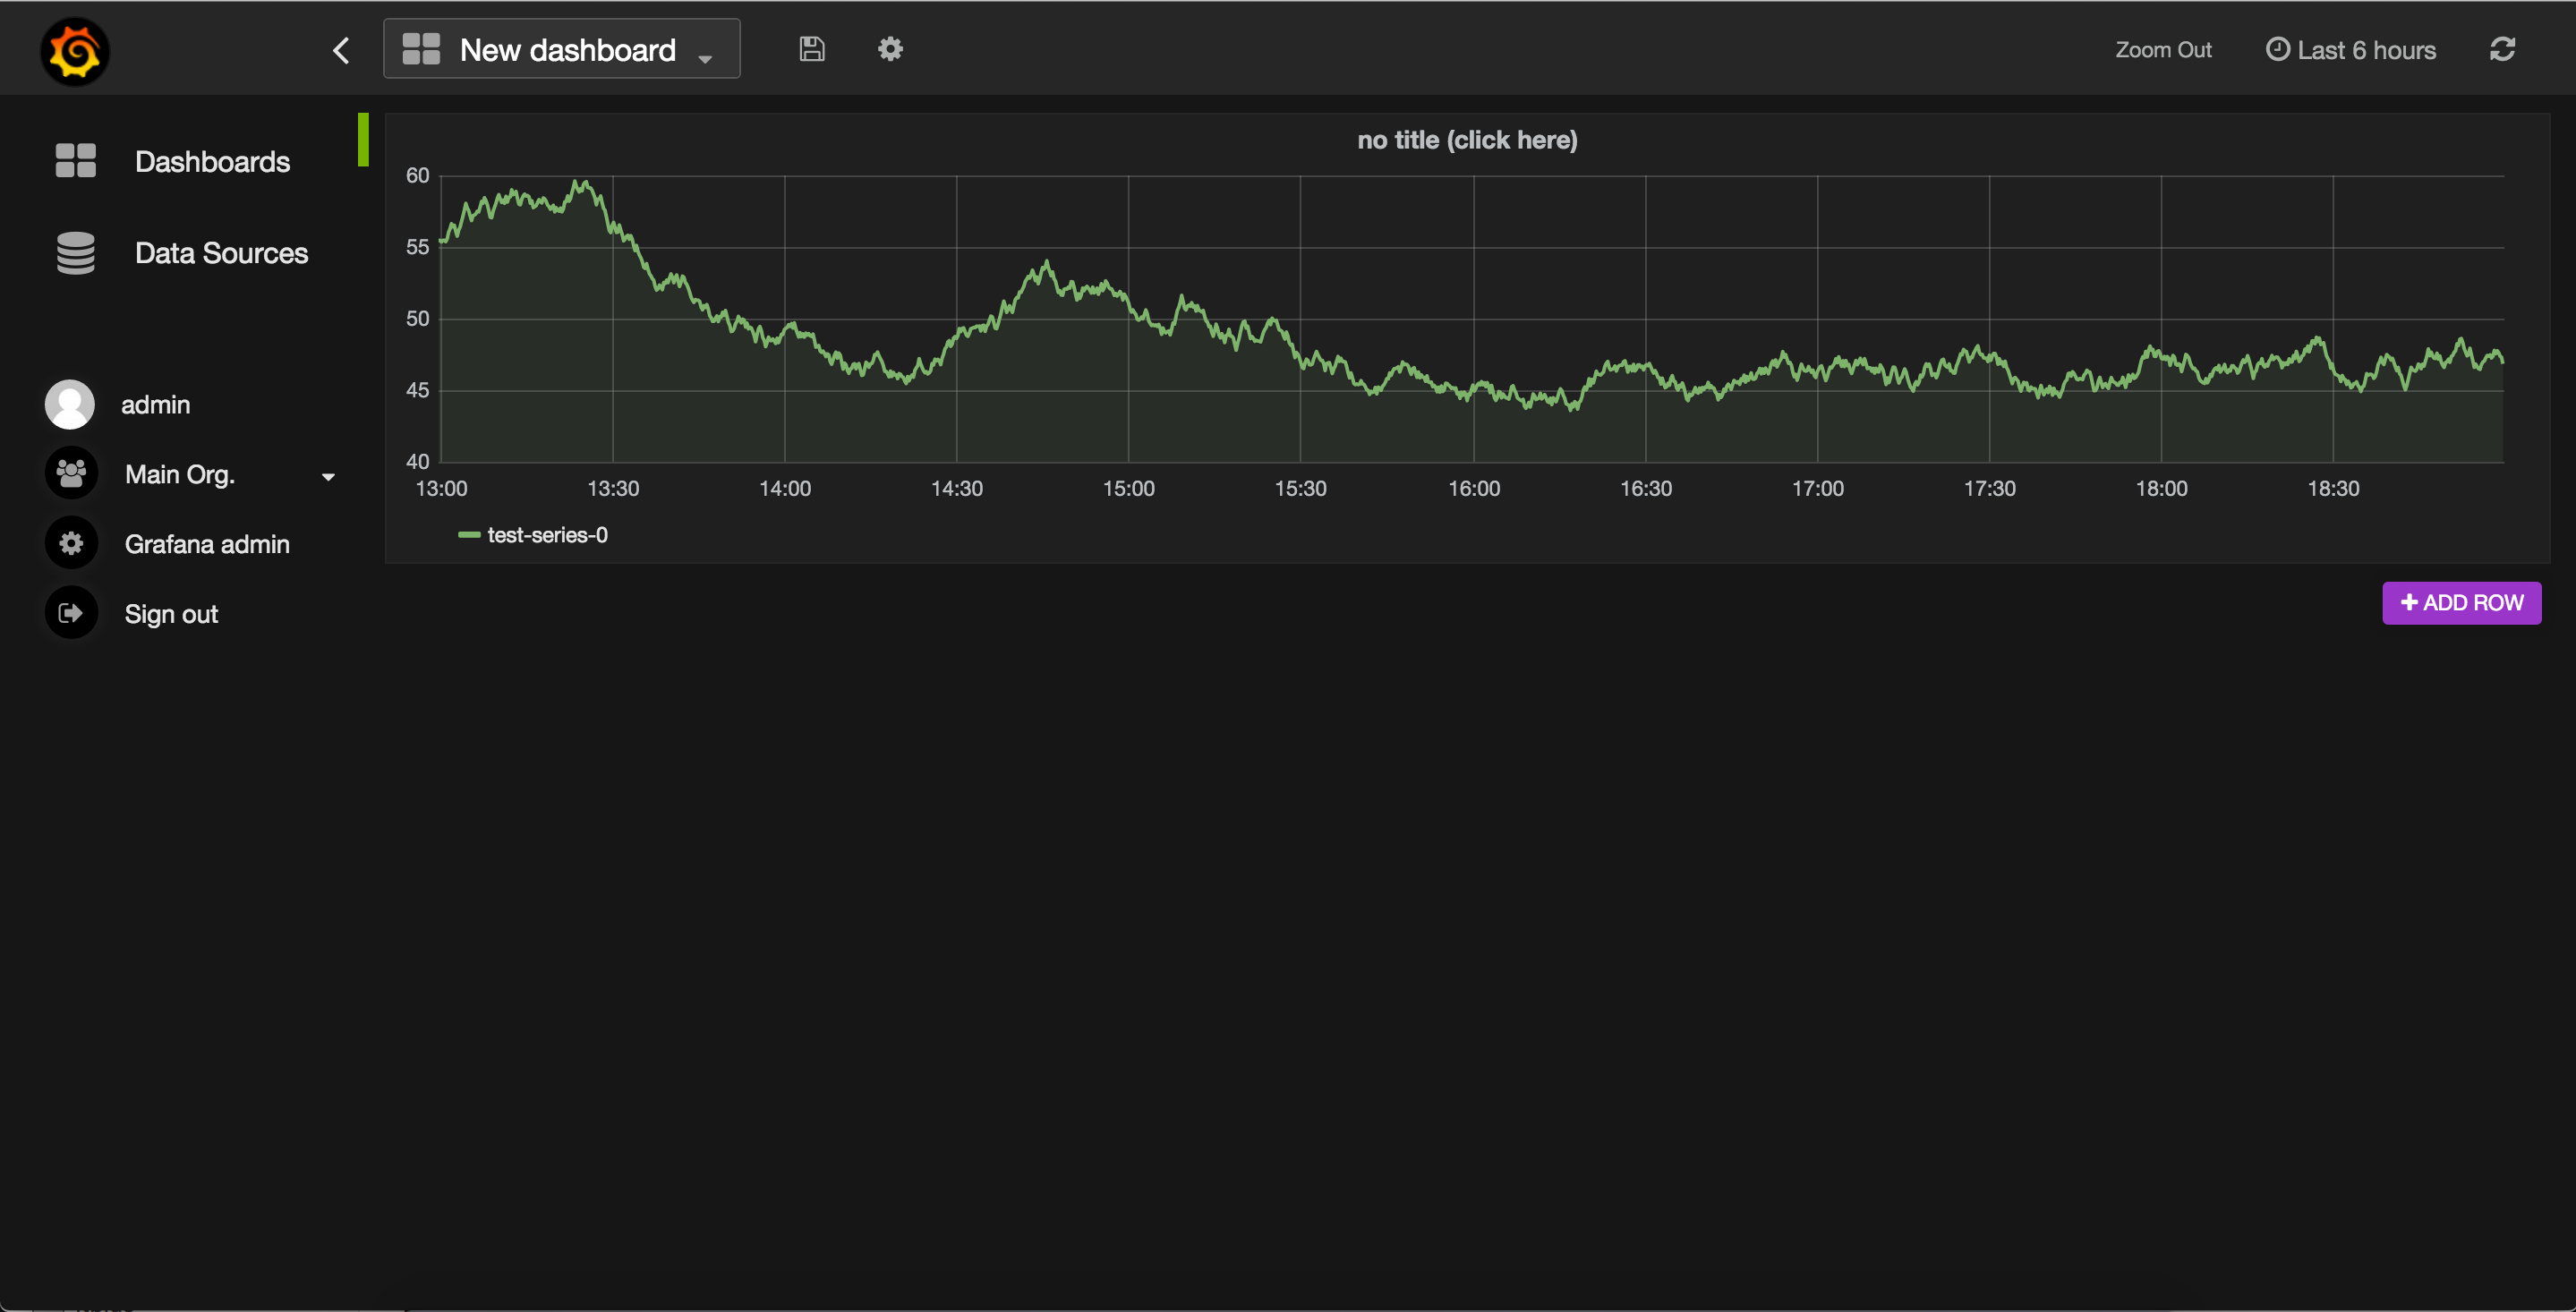
 Add a graph
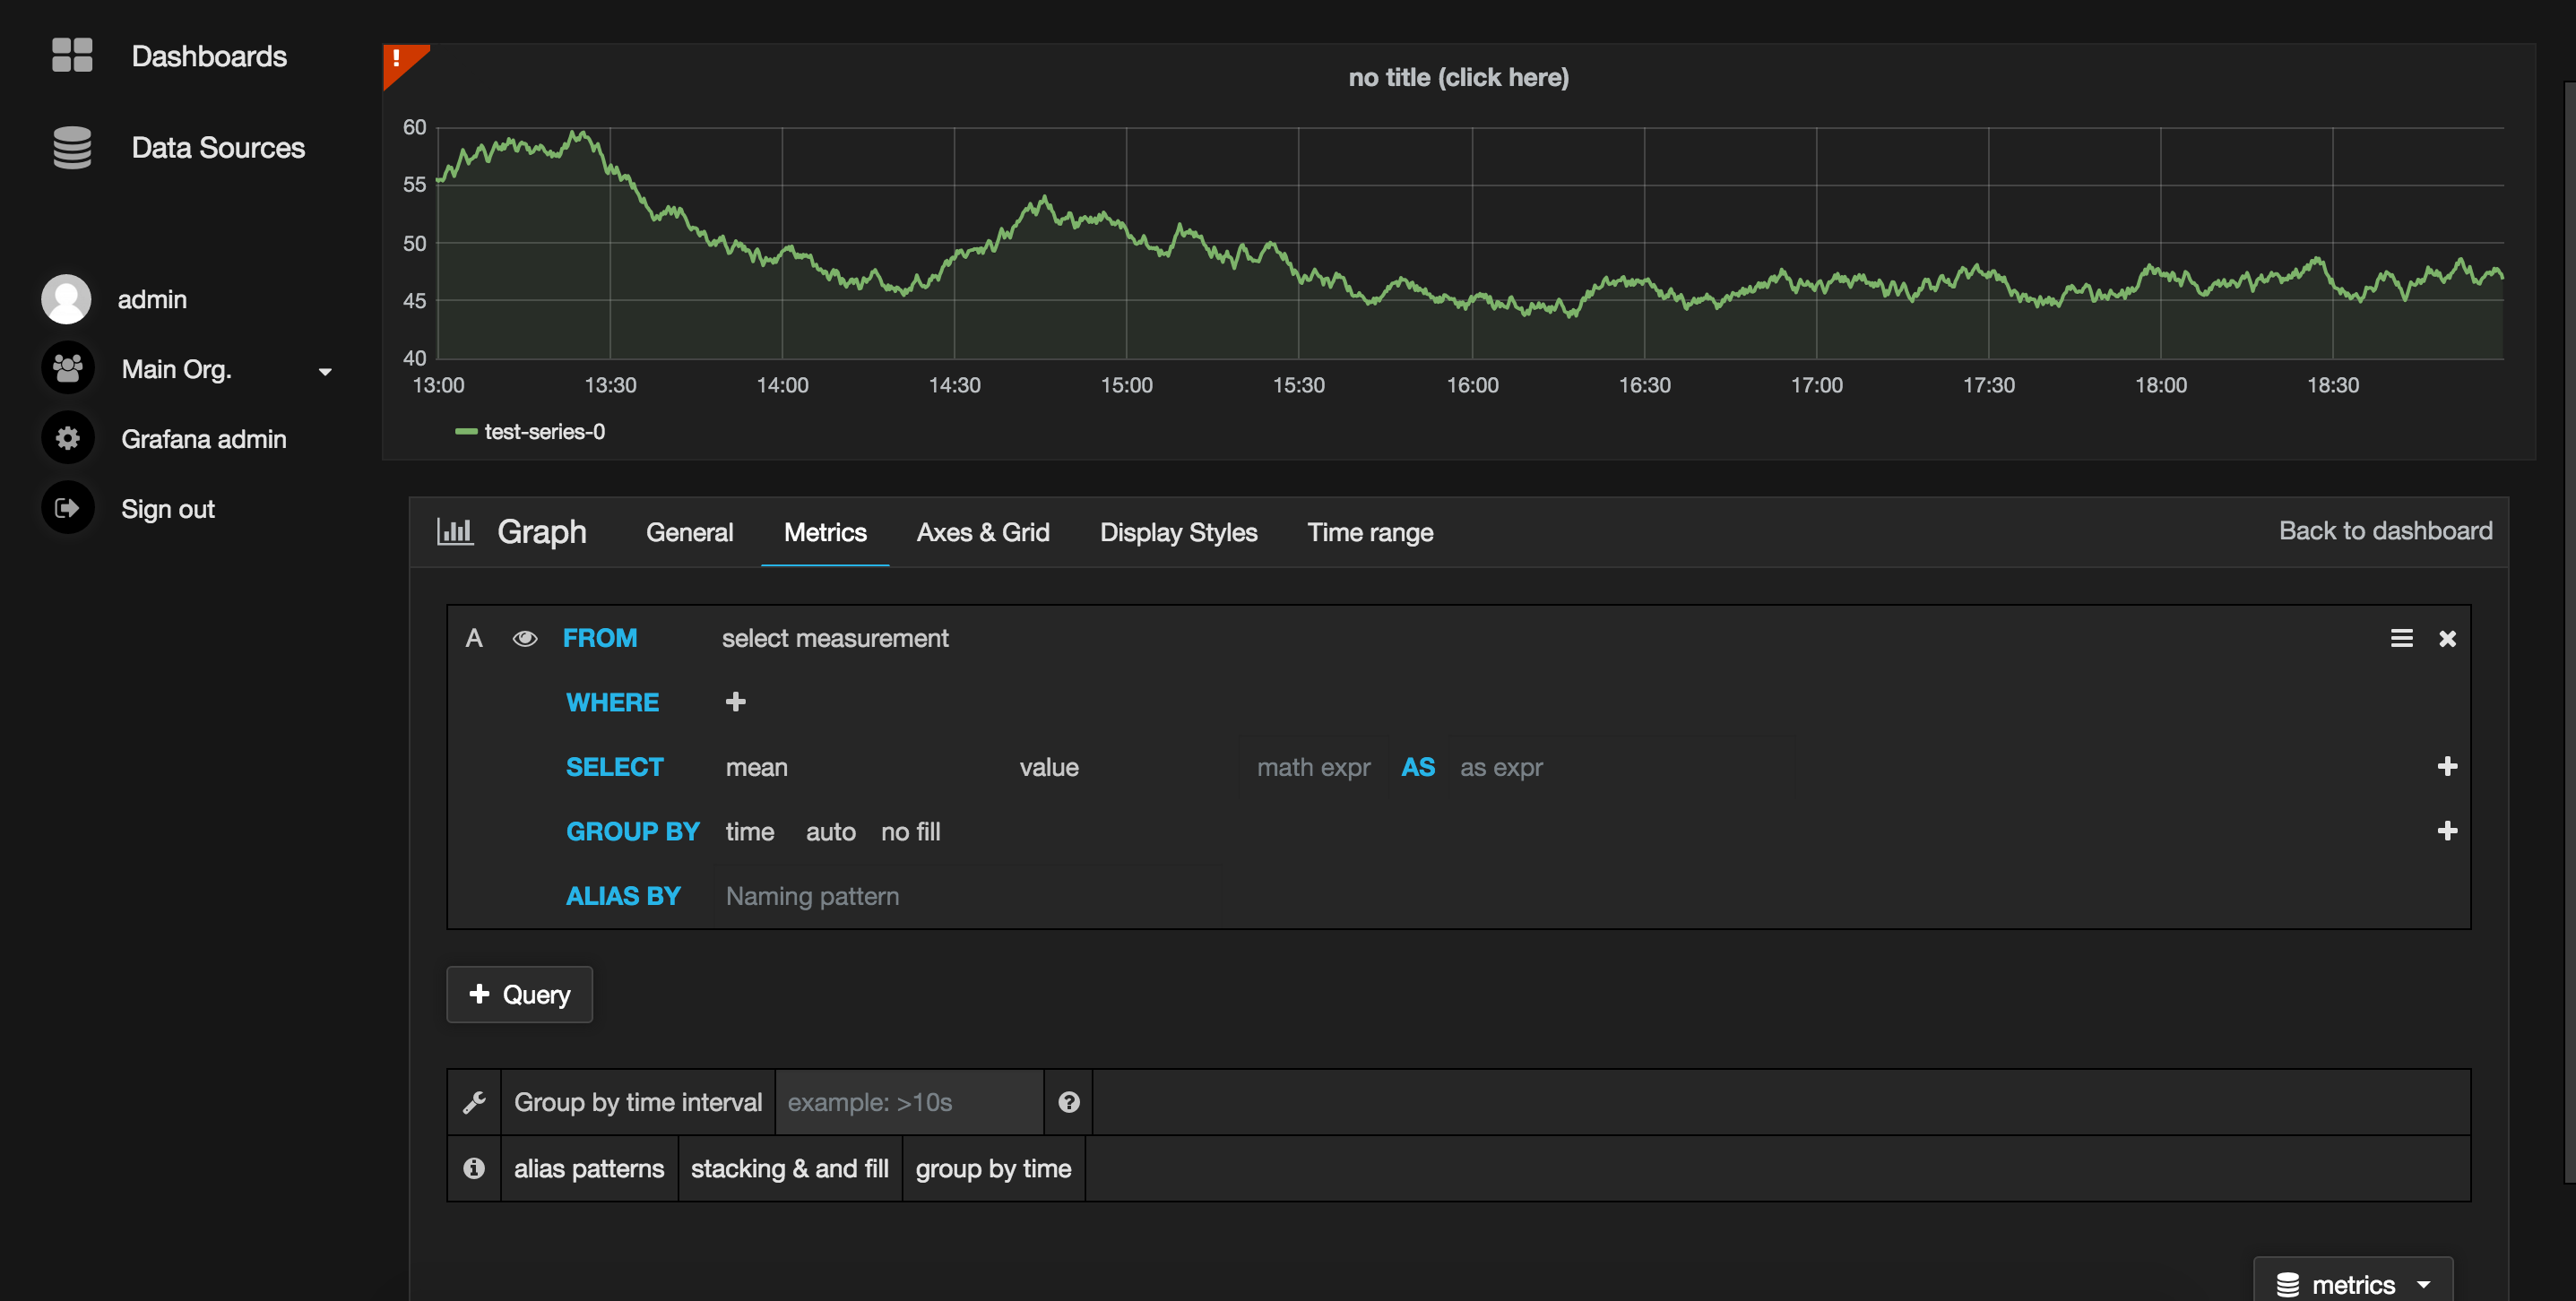
 After you add a graph you need edit it to use the data source that we created earlier.
 Edit the graph
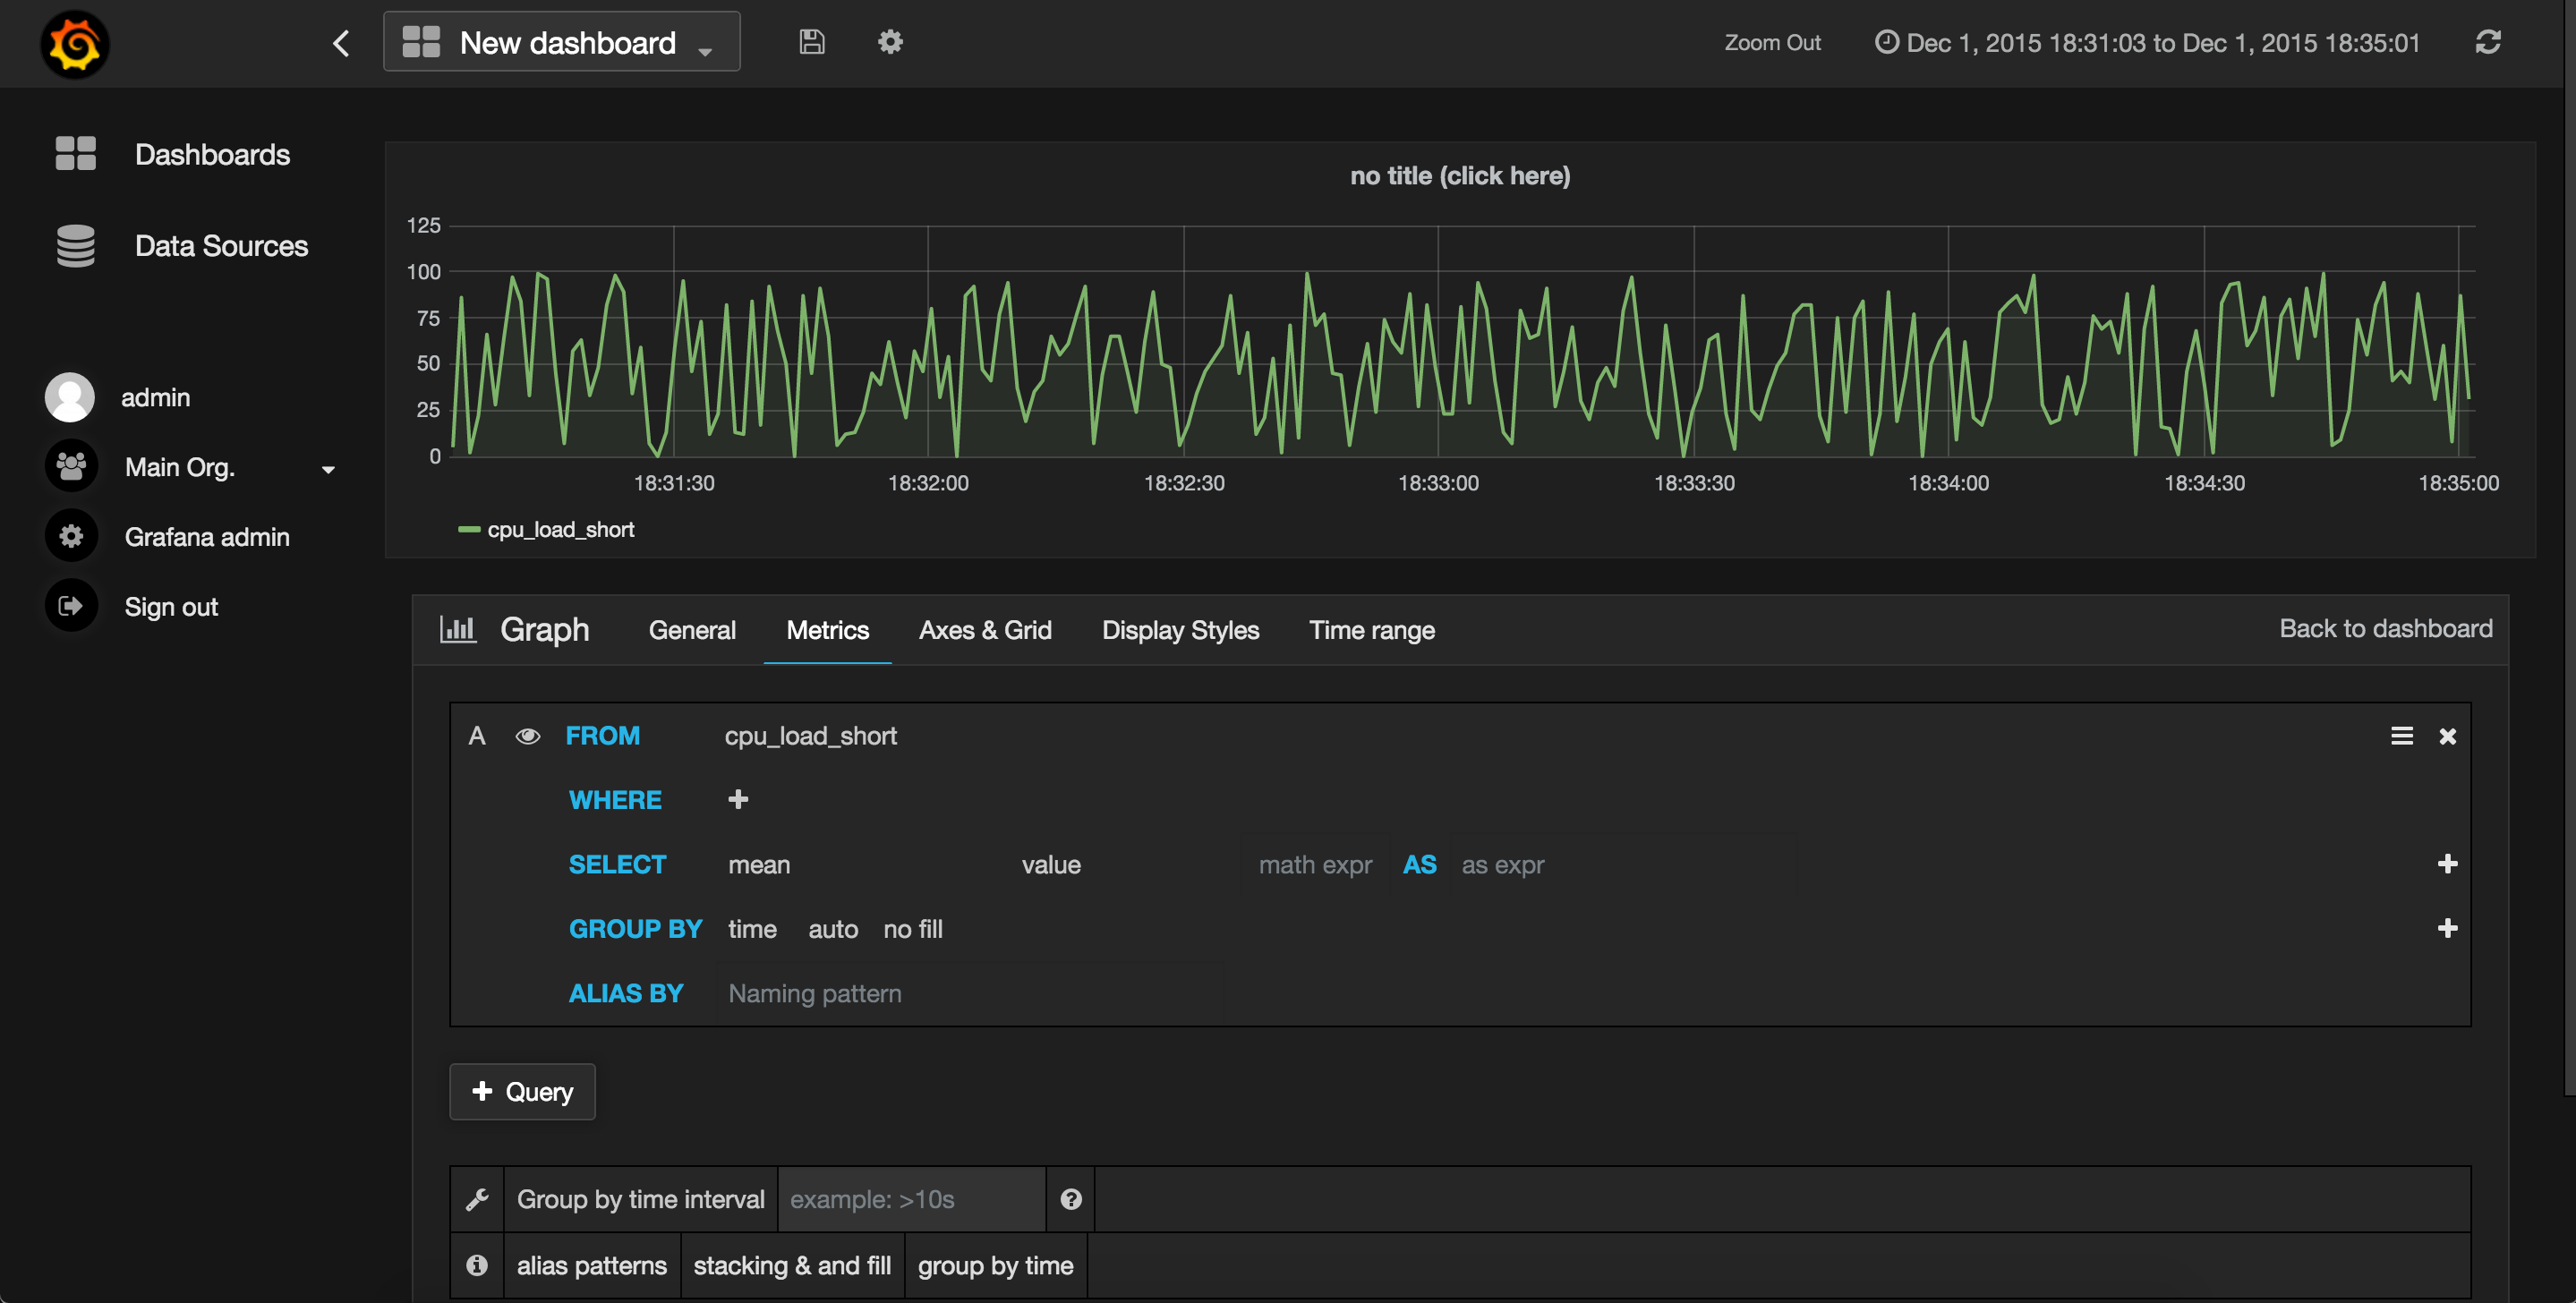
 Select the items as the graph, in this case we are using the measurement cpu_load
As I stated before Grafana integration with InfluxDB make things a lot easier, this is a simple tutorial, you can achieve much more.
InfluxDB also has his own data visualizer, check their announcement: https://influxdb.com/blog/2015/07/07/Announcing-Chronograf-a-data-visualization-tool-for-InfluxDB.html
I hope you find this tutorial useful, if you have any questions or suggestions feel free to ask in the comments.